
Welch's t-Test Calculator
📝 What is Welch's t-Test?
The Welch's t-Test (also called unequal variances t-test) compares the means of two independent groups without assuming equal variances or equal sample sizes. It's more robust than Student's t-test when these assumptions are violated.
💡 When to Use
- Independent Groups → Comparing two separate, unrelated groups
- Unequal Variances → When groups have different variability (no homoscedasticity)
- Different Sample Sizes → Groups can have different numbers of observations
- Normal Data → Data should be approximately normally distributed
- Continuous Variables → Measurements on interval or ratio scales
🎯 Interpretation Guide
- p < 0.001: Highly significant difference (very strong evidence)
- p < 0.01: Highly significant difference (strong evidence)
- p < 0.05: Significant difference (moderate evidence)
- p ≥ 0.05: No significant difference (insufficient evidence)
- Effect Size (Cohen's d): 0.2=small, 0.5=medium, 0.8=large
📊 Sample Datasets - Quick Start
• No Difference: Two groups with identical means
• Small Difference: Small but detectable difference (Cohen's d ≈ 0.2)
• Medium Difference: Moderate difference (Cohen's d ≈ 0.5)
• Large Difference: Large difference (Cohen's d ≈ 0.8+)
• Treatment vs Control: Medical treatment comparison
• Unequal Variances: Groups with very different variability
Click any dataset button to load sample data and see test results!
📈 Data Input
📊 Group 1 Data
Enter values for the first group. Each value should be separated by a comma.
📊 Group 2 Data
Enter values for the second group. Can have different number of values than Group 1.
📈 Plot Customization
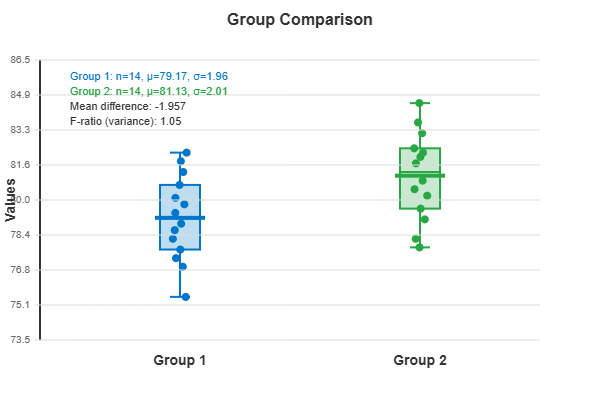
📈 Group Comparison Visualization
Shows distribution of both groups with individual data points, means, and box plots for comparison.
In many real datasets, group variances can differ by 30% or more from each other. This can make classic tests less reliable if ignored. Therefore, I used a Welch’s t test calculator when comparing two independent groups. It is made for unequal variances and helps avoid false positives.
This guide shows how a Welch’s t test works. You can use an t test online tool to run it. Just paste your raw data or enter the summarized statistics. The Welch’s test calculator provides the t statistic, degrees of freedom, p-value, and more.
Many tools also check for outliers and run Shapiro–Wilk tests. They can even generate R codes. I use plots, such as data points, means, and violin plots, to make the results easy to understand.
Welch’s method is a smart choice for independent groups. It keeps the Type I error in check when the variances are not equal. This advice comes from Welch (1947) and Satterthwaite (1946). Graeme Ruxton (2006) and others have also supported it. A Welch’s t test calculator offers both speed and accuracy.
Key Takeaways
- Use Welch’s t-test when group variances or sample sizes differ.
- A Welch’s t-test calculator reports t, df, p, mean difference, SE, and confidence intervals.
- Many online t-test tools accept raw data or summary inputs and can flag outliers.
- Welch’s method helps control Type I error under variance heterogeneity.
- The results were visualized with data points, means, CIs, and violin plots for context.
- Tools that generate R code and run Shapiro–Wilk normality checks were used.
What Is Welch’s t-Test and Why It Matters for Real-World Data
Welch’s test was used when two groups had different spreads. It is also called the unequal variances t-test. This method changes how we calculate the variability and Welch’s t-test degrees of freedom. This makes the results more stable when the groups vary differently.
Classic sources by Bernard Welch and Franklin Satterthwaite started it all. Modern reviews by Ruxton and Delacre support its use. Most data from healthcare, marketing, and product testing show variances that are uneven. Therefore, experts often explain why it is reasonable to use Welch’s t-test as a default.
Purpose: Comparing means with unequal variances
I use Welch’s test to compare two means when standard deviations differ. It maintains a fair comparison by considering the variance of each group. The method provides t, a p-value, and welch’s t-test degrees of freedom specific to the data.
Why it’s preferred as the default for independent groups
Many analysts have explained why it is reasonable to use Welch’s t-test first. It does not assume equal variances but works well even when they are. It handles unbalanced samples without extra steps and resists biases from skewed variability. This makes it a reliable first choice for independent group studies.
| Criterion | Welch’s t-Test | Student’s t-Test | Variance Assumption |
|---|---|---|---|
| No equal-variance assumption; robust with σ1² ≠ σ2² | Requires equal variances; sensitive to violations | ||
| Sample Size Balance | |||
| Works well with unequal n | Can mislead when n differs a lot | ||
| Degrees of Freedom | |||
| Welch–Satterthwaite; may be fractional | Simple integer formula | ||
| Type I Error Control | |||
| Stable under heteroscedasticity | Inflated when variances are unequal | ||
| Everyday Use | |||
| Often recommended default | Use when equal variances are credible |
How it controls Type I error under heteroscedasticity
Unequal variances may lead to false positives. Welch’s approach reduces this risk. It scales the standard error to each group’s spread and uses Welch’s t-test degrees of freedom that reflect uncertainty. This is why analysts explain why it is reasonable to use Welch’s t-test when the data show uneven noise.
When to Use Welch’s t-Test
I use Welch’s t-test when the variances are not the same or the sample sizes differ. If I am not sure about equal variances, Welch is my go-to. It is a simple way to decide without overthinking.
Quick cue: I also look at histograms and Q–Q plots for normal data. I also watch for outliers. If the data spreads were different, Welch’s t-test was chosen over Student’s t-test.
Unequal variances and unequal sample sizes
Assuming we have Group A (n=15, mean=42.3, SD=12.8) and Group B (n=35, mean=36.5, SD=5.4). The variance ratio was 5.62, and Levene’s test showed p=0.003. This means that Welch is the right choice for us.
For one sample, a one-sample t test was used. For paired data, a paired t-test is the best option. For three or more groups, ANOVA or Welch’s ANOVA was used.
As a conservative choice for two-group comparisons
Welch helps avoid Type I errors when the variances are different. This is key when one group is more variable or smaller in size. This affects the confidence intervals and p-values.
A Welch’s test online tool can quickly identify variance issues. This shows how the results change compared to the equal-variance models.
How Levene’s test and variance ratios inform your choice
I started with Levene’s test. If p
Many calculators check Shapiro–Wilk and outliers. With Welch’s test online tool, it is easy to know when to use Welch. We can see the logic with a clear example.
Welch’s t-Test vs. Student’s t-Test
I often compare welch’s t test and student’s t test. Both use a t statistic but differ in how they handle variance and degrees of freedom. This choice affects the error rates and the certainty of the p value.
Equal variances assumption: required vs. not required
Student’s t-test assumes equal variances. If not, the results can be off, mainly with uneven sample sizes. Welch’s 1947 method, on the other hand, doesn’t need equal variances. Welch’s formula for unequal variances was used.
I look at the spread and group sizes to decide. With different variabilities, Welch’s t-test is the better choice. The t statistic is the same, but the p-value is fairer.
Degrees of freedom: simple vs. Welch–Satterthwaite
Student’s t-test has df = n1 + n2 − 2, which is easy to understand. Welch’s method uses the Welch–Satterthwaite adjustment for df. This adjustment reflects the group variance and size without changing the t-statistic.
Welch’s formula adjusts df based on the data. This is helpful in marketing tests and clinical pilots, where groups are not balanced.
Robustness, power, and error rates in practice
Student’s t-test can increase Type I error under heteroscedasticity. Welch’s method keeps error rates low while maintaining power. When the variances are equal, Welch’s power loss is small.
Modern tools such as R, Python, and spreadsheet add-ins show both results. With the same t statistic but different df, the p values can differ. This is why Welch’s t-test vs. Student’s t-test is important in everyday analysis.
Core Concepts: t Statistic, p-Value, and Degrees of Freedom
I use three main tools when comparing two groups: the t-statistic, p-value, and degrees of freedom. The t statistic shows how different the means are from each other. It is calculated by taking the difference between the means and dividing by the standard error.
The p-value indicates the likelihood of our result if there is no real difference. A large p-value might indicate that we do not have enough data, not that there is no difference. The degrees of freedom help select the correct t-curve. Welch’s method can give us fractions, while the classic method uses n1 + n2 – 2.
When I use a t-test calculator, I look at more than just the p-value. I checked the mean difference, standard error, confidence interval, and degrees of freedom. I also look at the data for outliers and skew, because numbers alone cannot tell the whole story.
Tip: I always add a quick graph to my analyses. Seeing the data alongside the t-statistic helps me understand if extreme points are causing the result.
| Concept | What It Represents | How I Use It | Reported by a t test calculator |
|---|---|---|---|
| t statistic | Standardized mean difference over combined standard error | Judge direction and strength of the effect | Yes, with sign and magnitude |
| p-value | Evidence against the null at the chosen alpha | Assess compatibility with no difference | Yes, one- and two-tailed options |
| Degrees of freedom (df) | Shape of the t distribution (Welch can be fractional) | Select the correct reference curve | Yes, Student or Welch–Satterthwaite |
| Confidence interval | Range of plausible mean differences | Gauge precision and practical size | Yes, often 95% by default |
| Standard error | Uncertainty from sample variability | Understand how spread affects t | Yes, shown alongside means |
| Welch’s option | Handles unequal variances and sizes | Preferred default for independent groups | Available in a welch’s t test significance calculator |
I selected the Welch’s t-test significance calculator when the variances were different. A t-test calculator was used for quick summaries. Clear results help me focus on the size of the effect, how certain I am, and the assumptions behind the numbers.
Welch’s Formula and the Welch–Satterthwaite Degrees of Freedom
I used Welch’s t-test formula when two groups had different variances or sizes. It maintains the spirit of a two-sample comparison while remaining robust to real-world noise. Welch’s t formula mirrors the classic setup but swaps in a smarter approach to uncertainty.
The t statistic for independent samples
The core t statistic is t = (x̄1 − x̄2) / √ (s1²/n1 + s2²/n2). This resembles Student’s t-test, yet it is paired with a different degrees-of-freedom rule. I rely on this Welch’s t-test formula when sample spreads differ because the denominator blends each group’s variance scaled by its size.
How to calculate degrees of freedom for Welch’s t test
To see how to calculate degrees of freedom for welch’s t test, I apply the Welch–Satterthwaite equation: df = [(s1²/n1 + s2²/n2)²] / [((s1²/n1)²/(n1−1)) + ((s2²/n2)²/(n2−1))]. This adjusts for heteroscedasticity and unequal n values. A Welch’s t-test formula calculator uses this expression directly to output t, df, and a p-value from the corresponding t-distribution.
Interpreting fractional degrees of freedom
Because the df depends on sample variability, it can be fractional. This is expected with the Welch’s t formula because each group adds uncertainty in a different way. Modern tools, including any careful Welch’s t-test formula calculator, compute p from the t-distribution at that fractional df, following Satterthwaite (1946) and Welch (1947).
Assumptions of Welch’s t test and How to Check Them
I keep my checklist simple so that I can move quickly without missing the essentials. The assumptions of Welch’s t-test focus on design and distribution, not equal variances. I review independence, look for approximate normality and document variance heterogeneity. I also note tails, alpha, and Welch’s t-test degrees of freedom when using Welch’s test online tools for quick diagnostics.
Exactly two independent groups
I start by confirming that there are two groups and that observations are independent within and across groups. No paired data or repeated measures were observed. I checked the recruitment or assignment procedures to ensure that each participant appeared only once.
Before running the test, one- or two-sided tails and the alpha level were set. I record the sample sizes, means, and resulting welch’s t test degrees of freedom so that the analysis is transparent.
Approximate normality of the outcome variable
Welch’s test is robust to mild non-normality, but I check. I performed a Shapiro–Wilk test on each group and scanned the Q–Q plots for curved tails. I also reviewed the histograms and noted any extreme outliers that might have driven the results.
If the distributions appear heavy-tailed or the scale is ordinal, I consider a Mann–Whitney U test as a safeguard. When I use Welch’s test online, I rely on built-in normality flags and then verify with plots in R or Python.
Variance heterogeneity: diagnosing and documenting
Unlike Student’s t-test, equal variances are not required. Welch’s method handles σ1² ≠ σ2², which is why I check heterogeneity, not enforce equality. I run Levene’s test and review the variance ratios to understand the spread.
I document the evidence of heterogeneity and report the adjusted welch’s t test degrees of freedom that come from the Welch–Satterthwaite formula. When I work with Welch’s test online, I include the tool’s variance checks in my notes so that the record is complete.
How to Do a Welch’s t Test Step by Step
I followed a simple process for Welch’s t test. It works with raw data or summary data. I explain each step clearly so you can follow along with a spreadsheet, R, Python, or a Welch’s t-test calculator with p-value.
Set hypotheses and choose tails and alpha
- I state the null and alternative with an expected difference d when relevant: H0: μ1 = μ2 + d; and H1: μ1 ≠ μ2 + d.
- I selected two-tailed tests to detect any difference, or one-tailed tests when a justified direction was in play.
- I set alpha at 0.05 unless a preregistered plan or regulatory standard says otherwise.
Compute t, df, and the p-value
- I enter raw data or summarized stats: x̄1, x̄2, n1, n2, s1, and s2. Then I calculate welch’s t test using t = (x̄1 − x̄2 − d)/sqrt(s1²/n1 + s2²/n2).
- I used the Welch–Satterthwaite approach for fractional degrees of freedom and read the p-value from the t distribution with that df.
- Many tools also run Shapiro–Wilk, flag outliers, and export R code for reproducibility in RStudio, Jupyter, or GraphPad Prism software.
Report results with effect size and confidence intervals
- I reported t, df, p, the mean difference, and a 95% CI. I add Hedges’ g or Cohen’s d (unequal variances) for a scale-free context.
- I interpret p against alpha and note its practical importance. I visualize with data points, means, confidence intervals, or violin plots, as shown in GraphPad resources.
- For transparency, I include how to do a Welch’s t test in my methods and whether I used a Welch’s t test calculator with p-value to calculate Welch’s t test.
| Step | Inputs | Key Formula or Action | Output | Notes |
|---|---|---|---|---|
| 1. Hypotheses | d, tails, alpha | H0: μ1 = μ2 + d; H1: μ1 ≠ (or > / <) μ2 + d | Test plan | Two-tailed by default; alpha often 0.05 |
| 2. Compute t | x̄1, x̄2, n1, n2, s1, s2, d | t = (x̄1 − x̄2 − d)/√(s1²/n1 + s2²/n2) | t statistic | Handles unequal variances |
| 3. Degrees of freedom | n1, n2, s1, s2 | Welch–Satterthwaite df (fractional) | df | Needed for accurate p-value |
| 4. p-value | t, df, tails | t distribution lookup | p-value | Compare to alpha |
| 5. Effect size | x̄1, x̄2, s1, s2, n1, n2 | Hedges’ g or Cohen’s d (unequal variances) | Effect size | Report with 95% CI |
| 6. Visualization | Group data | Means, CIs, dots, violin | Figure | Clarifies magnitude and spread |
If speed is required, a Welch’s t-test calculator with p-value is used. Then, I copied the full report into my notes. Thus, the steps, numbers, and choices are easy to check and redo.
welch’s t test calculator
Welch’s t-test online calculator was used when group variances appeared uneven or sizes differed. It should guide me from data entry to t, p, and degrees of freedom, without guesswork.
Most dashboards allow me to switch tails, set alpha, and select effect sizes. I also like options that preview results as I type, so I can quickly spot data entry mistakes.
Input options: raw data or summarized statistics
I can paste the raw values for each group or enter summary statistics: name, mean, n, and standard deviation. With raw data, a Welch’s t test online calculator often runs Shapiro–Wilk, flags outliers, and offers R code to reproduce the test.
When only summaries are available, the engine computes the mean difference and standard error directly. This keeps the Welch’s t-value calculator accurate even when raw files are not available.
Welch’s t test p value calculator and t value outputs
After I submitted the data, I obtained the t statistic, one- or two-tailed p value, confidence interval, and mean difference. A strong Welch’s t-test p-value calculator also reports the standard error and allows me to compare Welch’s and Student’s results side by side.
These outputs help me decide whether the observed gap is meaningful and how precise the estimate is. Clear labels reduce the chance of mixing tails or alpha.
Welch’s t test degrees of freedom calculator details
Welch-adjusted degrees of freedom are often fractional, so I check that the welch’s t test degrees of freedom calculator applies the Welch–Satterthwaite formula. The interface should explain why df decreases with uneven variances or small n.
Advanced tools, such as Datanovia’s StatFusion or GraphPad Prism, add variance checks, such as Levene’s test, plus plots that show data points, means, and violin shapes for context.
| Feature | Why It Matters | How I Use It | SEO-Relevant Tool Note |
|---|---|---|---|
| Raw or Summary Input | Fits real workflows with or without raw files | Paste vectors or enter mean, n, SD per group | Handled by a welch’s t test online calculator |
| t and p Outputs | Core inference for two-group comparisons | Read t, tail choice, alpha, and CI together | Powered by a welch’s t test p value calculator |
| Degrees of Freedom | Controls p value under unequal variances | Check fractional df and method note | Verified with a welch’s t test degrees of freedom calculator |
| Effect Sizes | Quantifies practical difference | Select Hedges’ g or Cohen’s d | Often bundled with a welch’s t value calculator |
| Diagnostics | Confidence in assumptions and data quality | Review Shapiro–Wilk, Levene’s, outlier flags | Supported by many welch’s t test online calculator tools |
Using an Online Welch’s t Test Calculator Efficiently
An online Welch’s t-test calculator was used for fast, clear results. I simply enter my data, select the test type, and set the alpha level. It also shows the effect sizes and confidence intervals. Switching from Excel is easy and straightforward.
Welch’s test online tool features to look for
- Default to Welch’s test for independent groups with unequal variance.
- Inputs for raw data and summarized statistics: means, SDs, and sample sizes.
- One- or two-tailed options, with exact p-values and fractional df.
- Effect sizes (Hedges’ g or Cohen’s d) and confidence intervals.
- Assumption checks: Shapiro–Wilk for normality and Levene’s test for variance equality.
- Outlier flags, interactive plots, and side-by-side Student’s t-comparisons.
With a good t-test online workflow, I can obtain results quickly. I checked the t, df, and p values. Then, I examined the diagnostics.
From data entry to interpretation in minutes
- Paste data (or type means, SDs, n) from Excel or Google Sheets.
- Select tails and alpha; confirm that Welch is selected by default.
- Read t, df, p, and effect size, and copy CIs into your notes.
- Check normality and variance tests; and review outlier alerts.
- Export figures or replicate the results using the provided code.
Generating R code, normality checks, and outlier flags
Datanovia’s interface shows assumption checks and offers the R code. This allows me to redo the analysis later. I compare Welch’s t test with Student’s t test to see the impact of heteroscedasticity. Using a Welch t-test calculator excel path keeps my data organized.
Worked Welch’s t Test Example
I will show you a real example of Welch’s t test. It involves two patient groups that differ in age. The scores were spread out differently; therefore, we used Welch’s method. To check our math, we used Welch’s approximate t-test calculator or a t-test calculator Welch’s t statistic.
The data were obtained from two groups: older and younger patients. The older group had a wider spread in their scores. This affects the standard error and the degrees of freedom in Welch’s formula.
Comparing two groups with unequal variances
- Group A (older): n = 15, mean = 42.3, SD = 12.8
- Group B (younger): n = 35, mean = 36.5, SD = 5.4
- Variance ratio: 12.8² / 5.4² = 5.62; Levene’s p = 0.003
This example shows that we cannot pool variances because of the spread. A Welch’s approximate t-test calculator was used. However, I also performed the calculations manually.
Calculating t, df, and p with Welch’s formula
- t = (42.3 − 36.5) / sqrt(12.8²/15 + 5.4²/35) = 5.8 / 3.44 = 1.69
- df ≈ [(12.8²/15 + 5.4²/35)²] / [((12.8²/15)²/(15−1)) + ((5.4²/35)²/(35−1))] ≈ 16.2
- Two-tailed p for t = 1.69 with df = 16.2 ≈ 0.11
If we used Student’s t with equal variances, we would obtain df = 48 and p ≈ 0.097. A t-test calculator Welch’s t statistic shows these numbers and keeps the df fractional.
Interpreting significance and practical implications
We report: Welch’s t(16.2) = 1.69, p = 0.11. We also discuss the mean difference, confidence interval, and effect size, such as Hedges’ g. We mention the larger SD in the older group and how it adds to the uncertainty. For important decisions, we check the power and consider obtaining more data.
Power, Effect Size, and Significance in Welch’s Testing
I examined the magnitude of the difference and the amount of noise in the data. The p value changes based on the size of the difference, how spread out the data are, the sample sizes, and how strict we are. With different variances, Welch’s adjustment can lower the degrees of freedom. This might make it harder to find a difference but keeps the chance of a false positive low.
When planning a study, I decide on the size of the difference that I expect. I choose whether it is a one- or two-tailed test and how strict we should be. A Welch’s t-test significance calculator helped me determine the number of participants required for the study. If the data do not appear normal, other tests may be used; however, Welch’s test is often sufficient.
I do not think that a p-value over a certain limit means there is no difference. Sometimes, we cannot find a difference because we do not have sufficient data. Therefore, I also report the size of the difference, such as Cohen’s d or Hedges’ g, and how sure we are about it. If one group has a lot of variation, I try to obtain more data from that group to make the numbers more stable.
Tip: Many tools allow you to set the size of the difference. I used these as a starting point and adjusted them based on what I know from other studies or pilot data.
| Decision Input | What I Check | Why It Matters in Welch’s Test | Action With a welch’s t test significance calculator |
|---|---|---|---|
| Effect Size (d) | Practical meaning and expected difference | Drives power and sample size needs | Enter d to run power analysis and set targets |
| Variability | Group-specific standard deviations | Unequal variances lower df via Welch–Satterthwaite | Input SDs per group; explore rebalancing samples |
| Sample Sizes | Imbalance and feasibility | More data in the high-variance group can boost precision | Simulate different n per group to optimize power |
| Alpha and Tails | Two-tailed vs. one-tailed, α = 0.05 or stricter | Controls Type I error under heteroscedasticity | Set α and tails; review impact on detection |
| Reporting | Cohen’s d/Hedges’ g and confidence intervals | Complements p values with magnitude and precision | Export effect size and CIs alongside p and t |
I used Welch’s t-test significance calculator to plan my study. I report the size of the difference and use power analysis to ensure that my study is sufficiently large before I start.
Choosing Between Welch’s t-Test, Student’s t-Test, ANOVA, and Nonparametric Alternatives
I chose tests based on the number of groups and whether the data spreads were even. I also check if the data looks normal or if using ranks is better.
Two groups vs. three or more groups
Welch’s t-test was used for the two groups. This helps to keep errors low when the data spreads are different. If the variances seem equal, Student’s t-test is appropriate. However, I am cautious because of Zimmerman’s (2004) warning.
For three or more groups, I select ANOVA. If the spreads are not even, Welch’s ANOVA is used.
When normality is doubtful: Mann–Whitney U
If the data are skewed or heavy-tailed, I use the Mann–Whitney U test for two groups. It uses ranks for comparison, which helps with outliers. However, I do not use it when I need to compare means.
Welch’s ANOVA for unequal variances across multiple groups
For three or more groups with different spreads, Welch’s ANOVA is the best option. It deals with different variances and sizes while maintaining low errors. If there are significant effects, I will use special post hoc tests.
| Scenario | Preferred Test | Why This Choice | Notes on Assumptions | Two groups, unequal variances or sizes |
|---|---|---|---|---|
| Welch’s t | Controls Type I error under heteroscedasticity | Independent groups; approximate normality | ||
| Two groups, equal variances and sizes | ||||
| Student’s t | More power when equal-variance holds | Verify with care; preliminary tests can mislead | ||
| Three or more groups, equal variances | ||||
| ANOVA | Tests a global mean difference efficiently | Normal residuals; homogeneity of variance | ||
| Three or more groups, unequal variances | ||||
| Welch’s ANOVA | Robust to variance heterogeneity and imbalance | Use with heteroscedastic post hoc comparisons | ||
| Two groups, non-normal or ordinal | ||||
| Mann–Whitney U | Rank-based comparison reduces outlier impact | Similar shape distributions aid interpretation | ||
| Counts in categories | ||||
| Chi-square tests | Designed for frequency data | Not a substitute for t tests or ANOVA |
- Quick toolkit: Independent Samples t-Test Calculator (Welch by default), Levene’s Test Calculator, Mann–Whitney U Test Calculator, One-Way ANOVA, and Welch’s ANOVA.
- Regression and correlation assess associations, while t-tests and ANOVA compare group means.
- Levene’s test can inform variance equality; however, I prioritized Welch’s methods to remain robust.
Tips for Reporting, Visualizing, and Presenting Results
I ensure that the results are easy to read. Thus, anyone can understand the journey from the test to the conclusion. I followed the tips for reporting Welch’s t-test, focusing on clear, contextual, and transparent reporting. I use simple language and straightforward visuals to present data.
Clear result statements with t, df, p, and effect size
I have written the results in one clear sentence. It includes Welch’s t, df, p, mean difference, and effect size for each pair. The tails and alpha levels are also mentioned. Notes on checks for normality and variance were added.
I document any outlier handling and explain the reasons. These steps make the peer review easier and help with p-value interpretation.
Plotting means, datapoints, CIs, and violin plots
I show raw data with jittered dots, means and 95% CIs. When creating violin plots, the distribution shape and overlap are highlighted. GraphPad Prism helped me create these figures quickly and neatly.
If a tool cannot create graphs, I send the data to Prism or R. Thus, I can create figures that are ready for publication.
Avoiding common p-value misinterpretations
I explain that p is not the chance that the null is true. A p-value ≥ 0.05 does not imply that there is no effect. A small p-value does not imply a large effect.
I focus on estimation: effect sizes and confidence intervals show the size and precision. I also share the R code from the calculators to increase transparency and reproducibility.
| Element | What I Include | Why It Helps | Tooling Notes | Result Line |
|---|---|---|---|---|
| Welch’s t, df, p, mean difference, 95% CI, d/g, tails, alpha | Delivers the full statistical snapshot at a glance | Templates speed consistent reporting across studies | ||
| Assumption Checks | ||||
| Shapiro–Wilk, Levene’s test, and documented outlier handling | Shows rigor and supports valid inference | Flag any deviations and justify remedies | ||
| Visuals | ||||
| Datapoints, means, 95% CIs; optional violin plots | Clarifies spread, overlap, and group differences | Use GraphPad Prism or R when calculators lack plots | ||
| Interpretation | ||||
| Effect size with CI and careful p-value interpretation | Emphasizes magnitude and precision over dichotomies | Pair narrative text with numeric estimates | ||
| Reproducibility | ||||
| Share R code or settings exported from calculators | Enables verification and reuse | Archive code with version and seed when relevant |
Conclusion
I prefer tools that facilitate quick sound analysis. A Welch’s test calculator is useful for this purpose. It works well with unequal variances or sample sizes.
It keeps the Type I error in check. There is a small power loss when the variances match. This makes Welch’s t-test the go-to method for real experiments and surveys.
My workflow is simple and disciplined in nature. I set clear hypotheses and alpha values. I chose two-tailed tests unless a direction was justified.
I check normality with Shapiro–Wilk and variance equality with Levene’s test. Then, I compute the t-statistic, p-value, and Welch’s t-test degrees of freedom. A good Welch’s test calculator or a t-test calculator degrees of freedom feature helps me get accurate, fractional df without fuss.
Reporting is as important as computing. I present t, df, p, an effect size such as Hedges’ g, and confidence intervals. I also plotted raw data points, means, and violin plots to show the spread and spot outliers.
This practice follows advice from Bernard Welch (1947), Franklin Satterthwaite (1946), Graeme Ruxton (2006), and Stéphane Delacre and colleagues (2017). All support the use of Welch’s approach in routine work.
Modern online tools expedite this process. I can go from data entry to interpretation in minutes. Often, I get R code generation and basic diagnostics built-in.
With a reliable Welch’s test calculator and a t-test calculator degrees of freedom option, I obtain transparent results. I can trust and explain them easily.
FAQ
What is Welch’s t-test and when should it be used?
Welch’s t-test is for comparing two groups when their variances might not be the same. It is also known as the unequal variances t-test. This test adjusts the degrees of freedom to maintain a low error rate, even with different variances or sample sizes.
Why is Welch’s t-test a smart default for independent groups
It works well even when the variances are not equal. This makes it a good choice for many applications. Many experts recommend using Welch’s t-test by default.
How does Welch’s t-test control the Type I error under heteroscedasticity?
The test adjusts the degrees of freedom to maintain a low error rate. This is important when the variances are different. This helps maintain the false-positive rate near the chosen alpha.
How do I know it’s time to use Welch’s instead of Student’s t?
Switch to Welch’s if variances look different or if group sizes are very different. A large variance ratio and a significant Levene’s test were observed.
Is Welch’s t-test conservative for two-group comparisons?
Yes, slightly. It may have fewer degrees of freedom, which can slightly lower the power. However, it helps control Type I error, which is very important.
How do Levene’s test and variance ratios guide the choice?
Use Welch’s if Levene’s test is significant or the variance ratio is large. If the variances and sizes are similar, both tests might agree. However, Welch’s t-test is safer to use.
What is the key difference between Student’s and Welch’s t-tests?
The Student’s t-test requires equal variances. Welch’s t-test does not need equal variances. Welch’s uses the Welch–Satterthwaite formula to estimate degrees of freedom.
How do the degrees of freedom differ in practice?
The Student’s t-test yields an integer df when the variances are equal. Welch’s t-test gives a possibly fractional df. This helps to avoid false positives.
What about the robustness, power, and error rates?
Welch’s t-test is more robust than Student’s t-test. It controls the Type I error well, even with unequal variances. It has a small power cost when the variances are equal.
What are the core outputs I should expect from a Welch’s t-test calculator?
The t statistic, degrees of freedom, p value, mean difference, and standard error were obtained. Many tools also provide effect sizes and run assumption checks.
What is the formula for the t statistic in Welch’s test?
The t value is t = (x̄1 − x̄2 − d) / sqrt(s1²/n1 + s2²/n2). This is similar to the independent-samples t-test. The only change is how df is computed.
How do I calculate the degrees of freedom for Welch’s t-test?
Use the Welch–Satterthwaite equation: df = [(s1²/n1 + s2²/n2)²] / [((s1²/n1)²/(n1−1)) + ((s2²/n2)²/(n2−1))]. A good calculator can perform this calculation.
What does it mean if my degrees of freedom are fractional?
This is expected with Welch’s test. A fractional df reflects the uncertainty of unequal variances and sample sizes. The p-value is computed from the t-distribution using the fractional df.
What assumptions does Welch’s t test make?
Two independent groups, independent observations, and an outcome that is approximately normal within each group are required. Equal variances are not required— that is the point of Welch’s. If normality is highly questionable, consider using the Mann–Whitney U.
How do I check the assumptions before trusting the results?
Run Shapiro–Wilk for normality on raw data, inspect plots for outliers, and use Levene’s test or variance ratios for homogeneity. Many online tools flag outliers and provide diagnostic checks by default.
What are the steps to perform a Welch’s t test properly?
First, set hypotheses, pick one- or two-tailed, and choose alpha (often, 0.05). Next, enter the raw data or summaries (x̄, SD, n). The tool computes t, Welch’s df and p. Then, report t, df, p, effect size, and 95% CI, and interpret the results clearly.
How do I compute t, df, and p by hand or with a calculator
The plug group means, SDs, and ns were substituted into t = (x̄1 − x̄2)/sqrt(s1²/n1 + s2²/n2). Then, df is computed via Welch–Satterthwaite and the p value is obtained from the t distribution. A calculator can perform these steps.
How should I report the results, including the effect size and CI?
Write: “Welch’s t(df)=value, p=value, mean difference=Δ, 95% CI [L, U], effect size d/g=.” Specify tails and alpha, and mention assumption checks such as Shapiro–Wilk and Levene’s.
What input formats do Welch’s t test calculators support?
Most tools allow you to paste raw data or enter summarized statistics (group names, means, SDs, and ns). This flexibility is helpful when working with spreadsheets or published summaries.
What outputs will a Welch’s t-test calculator with p-value provide?
You will obtain the t value, df from the Welch–Satterthwaite formula, a one- or two-tailed p value, the mean difference, standard error, and a confidence interval. Many also include effect sizes and visualizations of the results.
How does a Welch’s t-test degrees of freedom calculator present df?
It shows a possibly fractional df based on group variances and sample sizes, often one or two decimals. This df is used for accurate p-value calculation under heteroscedasticity.
What features do the best Welch’s test online tools have?
Look for support for raw and summarized inputs, choice of tails and alpha, clear t and p outputs, effect sizes, confidence intervals, Shapiro–Wilk and Levene’s checks, outlier flags, and downloadable R codes. An Excel exporter is an added advantage.
How do I quickly go from data entry to interpretation?
Paste data, set tails and alpha, run the analysis, then review t, df, p, CI, and diagnostics. Cross-check the visuals before writing a clear results statement.
Can online tools generate R codes and run normality checks?
Yes. Many Welch’s test calculators generate reproducible R code, run Shapiro–Wilk, and flag outliers. Some also compare Student’s and Welch’s results side-by-side.
Can you show a worked example of Welch’s t test?
Sure. Suppose Group A (n=15, mean=42.3, SD=12.8) vs. Group B (n=35, mean=36.5, SD=5.4). The variance ratio was 5.62 and Levene’s p=0.003, so Welch’s t-test was used. t = (42.3 − 36.5)/sqrt(12.8²/15 + 5.4²/35) ≈ 1.69; df ≈ 16.2; p ≈ 0.11 (two-tailed). Not significant at p > 0.05.
How do I interpret the example’s t, df, and p-values?
I’d report: Welch’s t(16.2)=1.69, p=0.11. The 95% CI likely spans zero; therefore, I do not claim a difference. I also examined the effect size and considered whether the study had sufficient power.
What should I know about power, effect size, and significance?
Significance depends on the effect size, variability, sample size, and alpha. Welch’s df can be smaller, which reduces power a bit but keeps Type I error in check. Always pair p-values with effect sizes and confidence intervals.
How do I choose between Welch’s t, Student’s t, ANOVA, and Mann–Whitney U tests?
For two independent groups, we defaulted to Welch’s. For three or more groups, use ANOVA; if variances are unequal, use Welch’s ANOVA. If normality is doubtful or the outcome is ordinal, the Mann–Whitney U test should be considered.
What are the best practices for reporting and visualization?
Include t, df, p, effect size, and 95% CI. Data points, means, and CIs were plotted, and violin plots were used to show the distribution shape. As GraphPad Prism tutorials emphasize, visuals make interpretation clearer and highlight the outliers.
What are the common p-value mistakes to avoid?
Avoid saying p is the probability that the null is true or that p ≥ 0.05 proves no difference. Instead, it focuses on estimation, uncertainty, and practical significance using CIs and effect sizes.
Which references support the use of Welch’s approach?
Foundational work includes that of Satterthwaite (1946) and Welch (1947). The applied guidance was based on Ruxton (2006) and Delacre, Lakens, and Leys (2017). These sources encourage the use of Welch’s t-test as the default for independent two-sample mean comparisons.