
Did you know that 93% of flawed research studies failed because of bad participant picking? How you select your study participants is important.
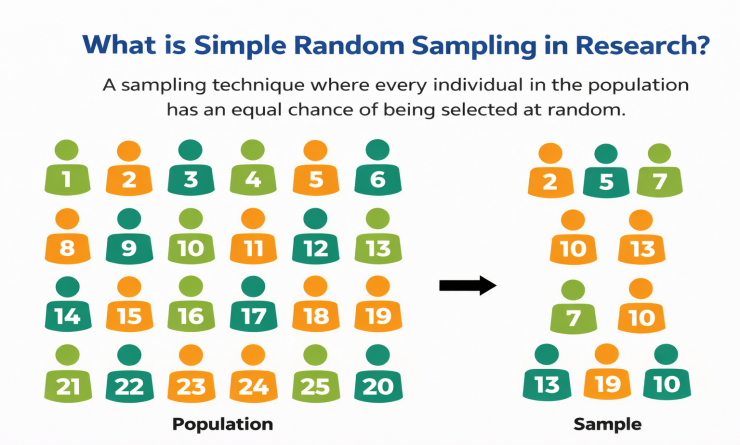
Simple random sampling ensures that everyone has an equal chance of joining the study. It is like a fair lottery, where everyone has the same ticket.
A simple random sample is a fair part of a larger group. Each person was picked fairly, without any favorites or exclusion. It is all about chance.
This method has an equal probability for everyone. This is important for health studies, school tests, or market research. This helps to avoid bad choices from the start.
Experts call it the “gold standard” because it’s easy and based on math. You are not simply picking people randomly. A systematic process is used to obtain reliable results that people can trust.
Key Takeaways
- Every person in a group has the same chance of being picked through fair methods.
- This method eliminates bad choices and gives you results that you can trust in many fields.
- It is different from randomly picking people because it follows clear, math-based steps.
- Researchers see it as the best way to study in the health, education, and social sciences.
- Your sample will really show what the bigger group is like if you do it correctly.
What is Simple Random Sampling in Research?
Exploring simple random sampling in research is similar to starting a research journey. This is a basic, yet powerful way to study things. It is used in many fields such as medicine, wildlife, ecology and market studies. This ensures that everyone has an equal chance of being picked up.
This method is similar to drawing names from a hat, but it is based on math. This ensured that the results were reliable. How you select your sample is very important for good research.
Core Definition and Concept
Simple random sampling means that each member has an equal chance of being selected. When researchers talk about it, it means that everyone has the same chance. This was the purest form of random sampling.
This method is concerned with fairness and objectivity. Everyone in the group has the same chance regardless of who they are. This is different from other methods, in which the researcher selects who to include.
In simple random sampling, a small group is created that represents the entire population. You are not just picking up random people. You are creating a representative sample to obtain accurate results.
This method provides a fair view of a group because it does not rely on human choices. You do not pick people based on who is easy to find or who volunteered first. Instead, math decides who gets picked up, making your research scientific.
The Role of Probability in Simple Random Sampling
Probability is key to simple random sampling. In this method, all subjects had an equal chance of being selected. This makes it a scientifically sound way to select participants.
Using the probability ensures that the results are reliable. Important statistics can be calculated, such as confidence intervals. Without probability, your findings will not be trustworthy.
Probability makes the selection predictable. One can guess how well the sample represents the population. This is because probability sampling is more accurate than the other methods.
Probability also keeps personal bias out of the selection process. If you pick the participants themselves, you might favor certain types. However, with probability, this is fair and random.
Imagine using numbers and a random number generator to select participants. Thus, everyone has an equal chance, regardless of how rare they are. It is fair and based on math rather than personal choices.
Distinguishing Simple Random Sampling from Other Methods
Knowing the difference between simple random sampling and the other methods is crucial. Each method has its own purposes and rules. You need to choose the right option for your research.
Simple random sampling is different from other methods in that it guarantees equal chances for everyone. Other methods, such as convenience sampling, pick whoever is easiest to find. Thus, simple random sampling is more reliable.
When comparing simple random sampling to other methods, the differences were subtle. Other methods such as stratified sampling divide the population into groups. Simple random sampling treats the population as an entire group.
| Sampling Method | Selection Process | Population Treatment | Best Used When |
| Simple Random Sampling | Equal probability for all members | Treated as single homogeneous group | Population is relatively uniform |
| Stratified Random Sampling | Equal probability within subgroups | Divided into distinct strata first | Population has important subgroups |
| Systematic Sampling | Selection at fixed intervals | Ordered list with pattern selection | Complete list is available and ordered |
| Cluster Sampling | Random selection of entire groups | Divided into geographical clusters | Population is geographically dispersed |
| Convenience Sampling | Non-random, based on accessibility | No systematic organization | Exploratory research with limited resources |
What makes simple random sampling unique is its simplicity and purity. You do not need to know the population before sampling. This method is simple and straightforward.
The disadvantage is that it may not be the most efficient. Other methods may also be better for certain situations. However, simple random sampling is the cleanest and easiest method to analyze.
In quantitative research, simple random sampling is unique, because it makes no assumptions. This is a fair and easy explanation. This makes it an excellent choice for many studies.
Understanding How Simple Random Sampling Works
Simple random sampling may seem simple, but it is the key to good research. It is used in many fields such as market research and health studies. Knowing how it works helps to obtain reliable results.
The Basic Mechanism of Random Selection
The first step was to determine the entire population. You must know who and what you are studying.
Then, a sampling frame was made with everyone in the population. It is like a big list for everyone you can study.
Next, we consider the number of individuals. For example, if you are studying 1,000 students, they are numbered from 1 to 1,000.
To pick randomly, old methods, such as drawing numbers, or new ones, such as random number generators, can be used. These tools are easy and fast to use.
Here’s how it works:
- Lottery-style draws: Numbers are pulled randomly
- Random number tables: Lists of random numbers for researchers
- Computer software: Programs that pick numbers instantly
- Online random generators: Web tools for random samples
Each person receives a number, and then, a random group is chosen. This group comprises the dataset.
Two Essential Conditions Every Simple Random Sample Must Satisfy
What makes the simple random sample valid? Two key conditions must be satisfied:
These conditions form the foundation of simple random sampling. Without them, the sample is not truly random.
Equal Probability of Selection
Everyone in the population must have the same chance of being picked. This is a must.
For example, if you are picking 100 out of 1,000, each person has a 10% chance. This opportunity must be the same for everyone.
You cannot give some people better odds than others do. It’s not fair. A student living on campus does not have a higher chance than one living off campus.
This equal chance makes selection fair. It prevents any group from gaining an unfair advantage.
Independence of Selection
The second condition pertains to independence. Each pick must be separated from the last pick.
Choosing one person should not change the chances of picking another person. If you pick Person #47, it does not affect Person #823’s chances.
Think of it, like flipping a coin. Even if you get heads five times, the sixth flip has 50% head. Previous results do not affect future results.
Independence prevents the sample from becoming biased. Without it, you might pick groups of related people, which is unfair.
These two conditions, equal chance and independence, make the sample valid. When both are met, you know that the sample is fair.
The Importance of Simple Random Sampling in Research
When you conduct research, the way you pick your sample is key. It determines whether the findings are real and useful. Simple random sampling ensured that the results were accurate and helpful.
This method is the best because it fixes on large problems in the studies. It works in many areas, such as how people shop and what treatments work. This is the least biased method to select a sample.
Eliminating Selection Bias from Your Study
Selection bias is a major problem in this research. This makes your study look bad before you begin. Simple random sampling fixes this by giving everyone an equal chance of being selected.
For example, if you only pick people who visit your store on Tuesdays, you miss others. Your results are not applicable to everyone.
Simple random sampling prevents these problems. It does not allow personal choices or easy access to decide who is in your sample. Every possible group had an equal probability.
When researchers pick samples unfairly, it requires more than just their study. This can lead to bad policies and wasted money. Simple random sampling keeps your research honest and reliable.
Creating Representative Samples of Your Population
A good sample looks like the whole group. Simple random sampling was used to ensure this. It does not favor any group over others.
For example, if you are studying people, your sample should have the same mix of age and income as the whole group. Simple random sampling does this without the need to balance the groups.
This method is simple and effective. It is not necessary to know the exact mix of the population beforehand. It captures the diversity of the group, whether 5,000 students or 200 million adults.
“Random sampling ensures that the sample is representative of the population, making it more likely that the findings can be generalized to the entire population.”
However, simple random sampling does not mean that the sample will be the same as the population. There will always be some variations. However, this method provided unbiased estimates. This means that if you did the study many times, your results would be closer to the true values.
Establishing Statistical Validity and Generalizability
Simple random sampling is key for making large claims about the entire population. Statistical validity was based on simple random sampling. Most statistical methods make this assumption.
Simple random sampling is required when formulas such as confidence intervals or t-tests are used. This ensured that the sample results were true for the entire population.
Generalizability means that your findings can be applied to more than just your sample. Simple random sampling ensured that the sample size was fair. This lets you say things like “We are 95% sure 60-70% of all customers prefer Option A.”
| Research Aspect | With Simple Random Sampling | Without Simple Random Sampling |
| Selection Bias | Mathematically eliminated through equal probability | Present due to systematic preferences or convenience |
| Sample Representativeness | Naturally reflects population diversity and proportions | May overrepresent accessible or willing participants |
| Statistical Inference Validity | Formulas and tests produce accurate confidence levels | Standard statistical procedures give misleading results |
| Generalizability of Findings | Results can be confidently extended to entire population | Conclusions limited to specific sample characteristics |
For example, in medical studies, the random selection of participants is very important. A study that randomly selects patients from all who could be in the study is much stronger. This affects if treatments are approved and if doctors recommend them.
Knowledge of how sampling affects statistics helps to improve studies. Your research has become more credible. It is not just about fancy analysis, but starts with a random sample. This makes your work both valuable and reliable.
How to Conduct Simple Random Sampling: Step-by-Step Process
Ready-to-perform simple random sampling. Follow a six-step guide from defining the population to collecting data. This guide converts random selection into steps that can be used in any research. Each step ensured that the sampling was fair and equal.
Simple random sampling requires detailed steps. Each step builds on the previous step, creating a strong base for fair data. Let us now examine how to use these steps in our research.
Define Your Target Population Clearly
The first step is to clearly define who is or what is in the population. We set clear inclusion and exclusion criteria. For example, when studying college students, decide whether to mean full-time or graduate students.
I think of this as drawing a clear boundary around your research. Every unit inside should be clear and different from that outside.
We considered both practical and theoretical aspects when defining the population. Asking yourself: What must someone have to fit your research question? The clearer your definition, the better the results.
Create a Complete Sampling Frame
A sampling frame is a list of all the population members. It could be an electoral register or a student database. The quality of the sampling frame was key to the validity of the study.
The sampling frame should be complete and updated. Missing entries indicate that some members cannot be chosen, which is unfair. The common frames include university directories and customer lists.
Check your frame for duplicates, old entries and gaps. Even small issues can introduce a bias.
Determine Your Appropriate Sample Size
Choosing the correct sample size was difficult. You need enough power to find important effects, but are limited by budget and time. Larger samples are more precise but cost more.
Statistical formulas help to determine the minimum sample size. A 95% confidence level with a 5% margin of error was considered a good start.
In addition, we have considered your population size. Smaller populations require larger sample sizes with the same precision.
Assign Unique Numbers to Population Members
Once you have a frame, give each member a unique sequential number. This number connects the list to a random selection. Start with 1 and go to the last member.
If you have 5,000 members, the number will be 1 between 5,000. For 250 members, the number is 1–250. This ensured that there was no confusion during the selection.
Keep a master list with each number and its corresponding members. This is required when selecting random numbers.
Select Your Random Sample Using Proven Techniques
The selection phase was the heart of simple random sampling. There are several reliable techniques to choose from. Pick one that fits your resources and population size.
All three methods ensure equal selection probabilities. Your choices depend on the tool, sample size, and preference.
Random Number Tables Method
Random number tables are a collection of digits. They can be found in textbooks and online. To use them, close your eyes and point to a starting position and then read consecutive digits.
If the population is 1-500, read three digits at a time. Skip numbers greater than 500 or duplicates. Keep going until you have your samples.
Computer-Generated Random Numbers Method
Modern methods use random computer-generated numbers. These methods are fast, accurate, and easy to reproduce. Excel’s RAND or RANDBETWEEN function for smaller populations.ECORSTATS, R, SPSS, and SAS were used for larger studies.
Online number generators are free and easy to use. Just enter your population and sample sizes, and get your random selection. These digital methods avoid human error and save time.
Lottery or Draw Method
The lottery method is simple and can be used for small populations. Each number is written on paper, mixed, and the required numbers are drawn. This method is useful for showing the selection process.
However, this is impractical in large populations. This is slow compared with computer methods.
Contact and Collect Data from Selected Participants
After selecting the sample, it was time to collect the data. Use your master list to identify selected individuals. Contact them through email, phone, or mail, depending on the research.
Being ready for non-response. Some participants might not have responded or could not be reached. Document all attempts and responses. High non-response rates can harm the representativeness of a sample.
Trying different strategies to obtain more responses. Multiple attempts, varied times, and incentives may be helpful in this regard. Keep detailed records of who responds, declines, or cannot be reached.
Sample Selection
Simple Random Sampling
Your Simple Random Sample:
How it works:
- Enter your population size (N) - the total number of items
- Enter your desired sample size (n) - how many items to select
- Click "Generate Sample" to randomly select n items from the population
- Each number represents an item from your population (numbered from 1 to N)
Key Properties:
- Each element has probability n/N of being selected
- Selection is without replacement (no duplicates)
- Results are displayed in ascending order for clarity
- Perfect for unbiased statistical sampling
Example of Simple Random Sampling in Research
Simple random sampling is widely used across disciplines because every member of the population has an equal and independent chance of being selected. Below are clear, practical research-based examples.
1. Dairy Cattle Mastitis Screening
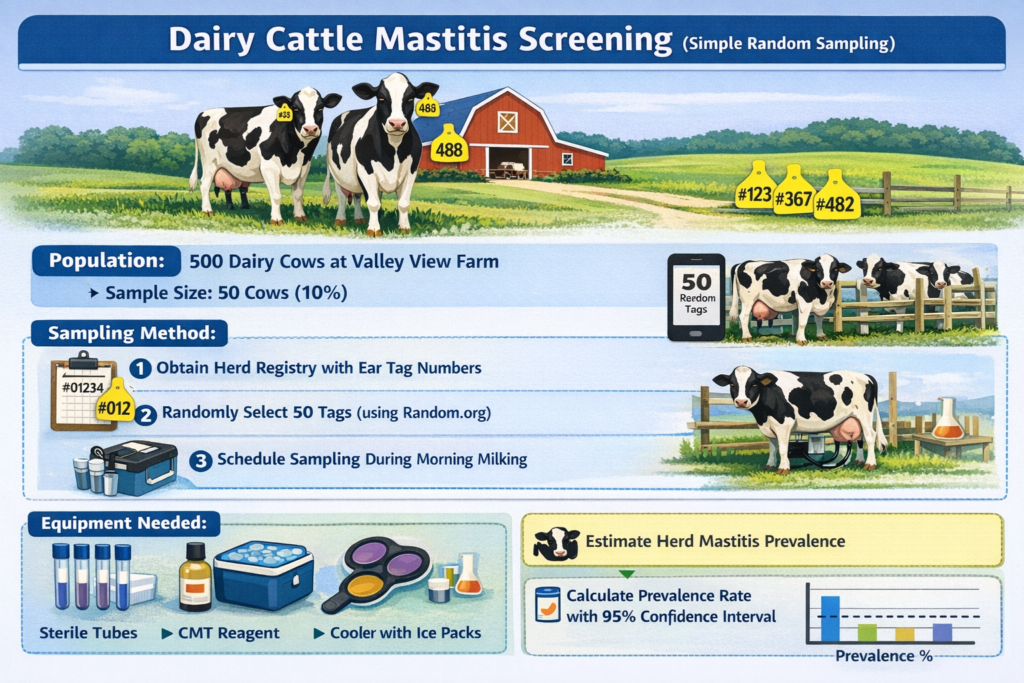
Population: 500 dairy cows at Valley View Farm
Sample size: 50 cows (10%)
Sampling method:
- Obtain complete herd registry with ear tag numbers
- Use random number generator app (e.g., Random.org) to select 50 tag numbers
- Schedule sampling during morning milking for consistency
Field procedure:
- Collect milk samples from selected cows
- Record cow ID, lactation number, days in milk
- Perform California Mastitis Test on-site
- Send samples to lab for somatic cell count
Equipment needed: Sterile collection tubes, CMT reagent, cooler with ice packs, field data sheets
Purpose: Estimate herd-level mastitis prevalence without testing entire herd
Timeline: 2-3 hours for sample collection
Analysis: Calculate prevalence rate with 95% confidence interval
2. Rice Paddy Pest Infestation Assessment

Population: 20-acre rice paddy with approximately 2 million plants
Sample size: 100 plants
Sampling method:
- Divide field into 100m × 100m grid using GPS/measuring tape
- Number each grid square (1-80)
- Use random number table to select 100 specific coordinates
- Mark locations with flag stakes
Field procedure:
- Visit each marked location
- Examine the nearest rice plant thoroughly
- Count pest insects per plant (stem borers, leaf folders)
- Record plant height and damage severity (scale 1-5)
- Photograph damage for documentation
Equipment needed: GPS device, measuring tape, flags, hand lens, insect identification guide, clipboard
Purpose: Determine if pest levels exceed economic threshold for pesticide application
Timeline: 4-6 hours fieldwork
Decision point: If >20% of plants show damage, initiate pest management
3. Urban Pigeon Disease Surveillance
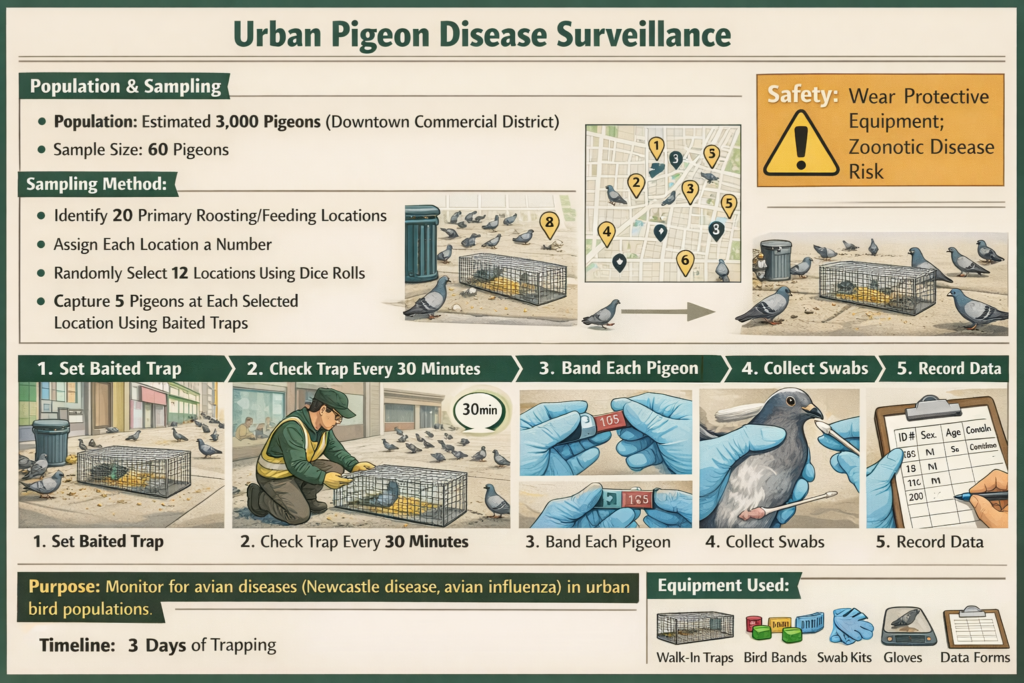
Population: Estimated 3,000 pigeons in downtown commercial district
Sample size: 60 pigeons
Sampling method:
- Identify 20 primary roosting/feeding locations
- Assign each location a number
- Randomly select 12 locations using dice rolls
- Capture 5 pigeons from each selected location using baited traps
Field procedure:
- Set walk-in traps with corn bait at dawn
- Check traps every 30 minutes
- Band each captured pigeon with unique ID
- Collect oral and cloacal swabs
- Record sex, approximate age, body condition
- Release at capture site
Equipment needed: Walk-in traps, bird bands, swab kits, gloves, safety goggles, portable scale, data forms
Purpose: Monitor for avian diseases (Newcastle disease, avian influenza) in urban bird populations
Timeline: 3 days of trapping
Safety: Wear protective equipment; zoonotic disease risk
4. Python Population Study in Wetland
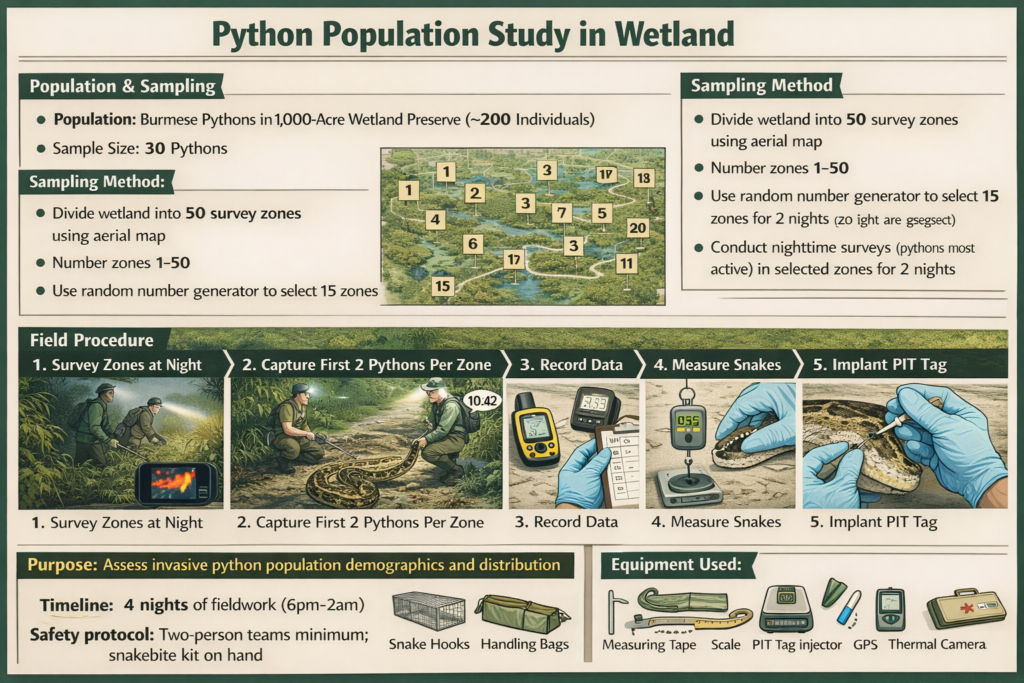
Population: Burmese pythons in 1,000-acre wetland preserve (estimated 200 individuals)
Sample size: 30 snakes
Sampling method:
- Divide wetland into 50 survey zones using aerial map
- Number zones 1-50
- Use random number generator to select 15 zones
- Conduct nighttime surveys (pythons most active) in selected zones for 2 nights
Field procedure:
- Walk predetermined transects with headlamps and thermal imaging
- Capture first 2 pythons encountered per zone
- Record GPS coordinates, time of capture
- Measure length, weight, sex determination
- Check for external parasites and injuries
- Implant PIT tags for future identification
- Take scale clippings for genetic analysis
- Release at capture location
Equipment needed: Snake hooks, handling bags, measuring tape, scale, PIT tag injector, GPS, thermal camera, first aid kit
Purpose: Assess invasive python population demographics and distribution
Timeline: 4 nights of fieldwork (6pm-2am)
Safety protocol: Two-person teams minimum; snakebite kit on hand
5. Wheat Field Disease Monitoring

Population: 40-acre wheat field with approximately 4 million plants
Sample size: 80 sampling points
Sampling method:
- Create grid with 50-meter spacing
- Number all grid intersections (160 points)
- Use random number app to select 80 points
- Mark with GPS coordinates
Field procedure:
- Navigate to each GPS point
- Examine 5 plants within 1-meter radius of point
- Record disease symptoms (rust, blight, mildew) on leaves
- Calculate disease severity percentage (0-100%)
- Note growth stage (Zadoks scale)
- Collect leaf samples from diseased plants
Equipment needed: GPS device, field notebook, plant disease guide, sampling bags, camera, 1m² quadrat frame
Purpose: Determine need for fungicide application based on disease threshold levels
Timeline: 6-8 hours
Economic threshold: Apply fungicide if >10% of sample points show >5% disease severity
6. Reef Fish Biodiversity Survey

Population: Fish population along 2km coral reef section
Sample size: 40 survey locations
Sampling method:
- Divide reef into 50m segments (40 segments total)
- Number segments sequentially
- Use underwater slate with pre-selected random numbers (20 segments)
- Conduct 2 dives per selected segment
Field procedure:
- Deploy 25m transect line at random compass bearing
- Swim along transect at constant speed
- Count and identify all fish within 2.5m either side (125m² area)
- Record species, size class, abundance
- Note coral health and habitat type
- Underwater photography for verification
Equipment needed: SCUBA gear, underwater slates, transect lines, fish ID cards, dive computer, underwater camera
Purpose: Monitor reef fish community composition and detect population changes
Timeline: 4-5 days (2 dives per day)
Data analysis: Calculate species diversity indices (Shannon, Simpson)
7. Backyard Chicken Parasite Survey
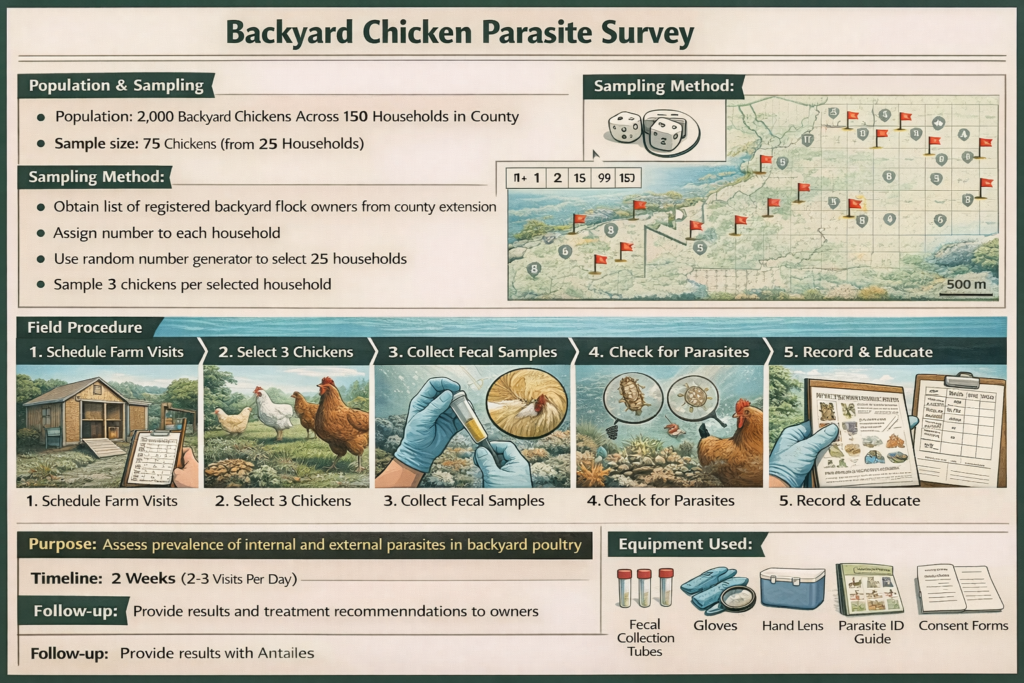
Population: 2,000 backyard chickens across 150 households in county
Sample size: 75 chickens (from 25 households)
Sampling method:
- Obtain list of registered backyard flock owners from county extension
- Assign number to each household
- Use random number generator to select 25 households
- Sample 3 chickens per selected household
Field procedure:
- Schedule farm visits
- Select 3 chickens using random selection (e.g., first three captured)
- Collect fresh fecal samples directly from vent
- Examine feathers and skin for external parasites
- Record breed, age, housing type, flock size
- Provide parasite prevention education to owners
Equipment needed: Fecal collection tubes, gloves, hand lens, parasite ID guide, cooler, consent forms
Purpose: Assess prevalence of internal and external parasites in backyard poultry
Timeline: 2 weeks (2-3 visits per day)
Follow-up: Provide results and treatment recommendations to owners
8. Mangrove Seedling Survival Study

Population: 5,000 mangrove seedlings planted in restoration site (10 acres)
Sample size: 150 seedlings
Sampling method:
- Site divided into 100 equal plots (10m × 10m)
- Each plot contains approximately 50 seedlings
- Use random number table to select 30 plots
- In each selected plot, randomly select 5 seedlings
Field procedure:
- Navigate to plot corners using measuring tape from baseline
- Within plot, use random compass bearing and distance (1-10 paces)
- Tag selected seedling with waterproof numbered tag
- Measure height, stem diameter, leaf count
- Record survival status (alive/dead)
- Note environmental factors (water depth, soil type, nearby vegetation)
- Photograph each seedling
Equipment needed: Measuring tape, calipers, waterproof tags, GPS, camera, waders, tide chart
Purpose: Evaluate restoration project success and identify factors affecting survival
Timeline: Quarterly monitoring over 2 years, 2 days per survey
Target metric: >70% survival rate after one year
9. Pond Turtle Population Health Check
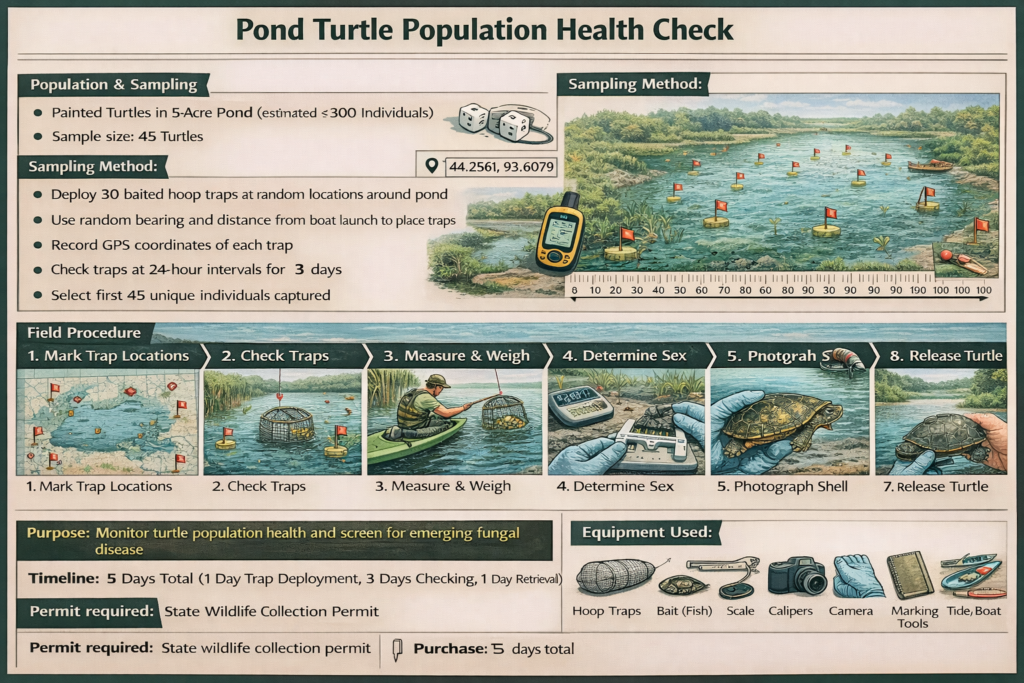
Population: Painted turtles in 5-acre pond (estimated 300 individuals)
Sample size: 45 turtles
Sampling method:
- Deploy 30 baited hoop traps at random locations around pond
- Use random bearing and distance from boat launch to place traps
- Record GPS coordinates of each trap
- Check traps at 24-hour intervals for 3 days
- Select first 45 unique individuals captured
Field procedure:
- Mark trap locations on map
- Check traps early morning
- Record capture location and time
- Measure carapace length, width, height
- Weigh each turtle
- Sex determination (tail length, claw size)
- Photograph shell patterns for individual ID
- Inspect for injuries, lesions, shell abnormalities
- Notch shell for permanent marking (marginal scutes)
- Collect oral swabs for disease screening
- Release at capture location
Equipment needed: Hoop traps, bait (fish), scale, calipers, camera, marking tools, gloves, field notebook, kayak/boat
Purpose: Monitor turtle population health and screen for emerging fungal disease
Timeline: 5 days total (1 day trap deployment, 3 days checking, 1 day retrieval)
Permit required: State wildlife collection permit
10. Migratory Warbler Stopover Ecology

Population: Transient warblers using 200-acre woodland during spring migration (estimated 2,000 birds pass through)
Sample size: 100 warblers
Sampling method:
- Woodland divided into 20 sampling stations
- Use random number generator to activate 10 stations per day
- Alternate station selection daily over 10 days
- Capture using mist nets at active stations
Field procedure:
- Open mist nets 30 minutes before sunrise
- Check nets every 20 minutes
- Extract birds carefully from nets
- Place in cloth bags for processing
- Record species, age, sex
- Measure wing length, tail length, body mass
- Assess fat score (0-5 scale) to evaluate refueling
- Apply uniquely numbered aluminum leg band
- Collect single blood drop for genetic analysis
- Release immediately after processing
- Close nets at 11am (bird activity decreases)
Equipment needed: Mist nets (12m), poles, bird bands, banding pliers, ruler, scale (0.1g precision), fat score chart, blood collection supplies, bird handling bags
Purpose: Study stopover habitat use and assess body condition during migration
Timeline: 10 consecutive days during peak migration (early May)
Implementation Checklist for All Examples
Pre-fieldwork:
- Obtain necessary permits and permissions
- Generate random sample selections
- Prepare field data sheets
- Calibrate all equipment
- Check weather forecast
- Review safety protocols
- Pack first aid kit
During fieldwork:
- Follow exact sampling protocol
- Record all data immediately
- Photograph samples/subjects when possible
- Note any deviations from protocol
- Maintain chain of custody for samples
- Back up data daily
Post-fieldwork:
- Enter data into spreadsheet/database
- Calculate basic statistics
- Submit samples to laboratory if applicable
- Clean and maintain equipment
- Write field report with observations
Advantages and Disadvantages of Simple Random Sampling
Before you start using simple random sampling, consider its positive and negative aspects. This method is powerful for research, but has practical challenges. Knowing the advantages and disadvantages of simple random sampling helps make the right choice for the study.
The advantages and disadvantages of simple random sampling are significant when comparing different methods for selecting a sample. Each study has its own needs and what works for one might not work for another.
Key Advantages of Simple Random Sampling
Simple random sampling has many benefits, making it the top choice for research. The advantages of simple random sampling explain why it is favored when possible. Let us examine the four main strengths that make it valuable for science.
Unbiased and Fair Representation
This method eliminated selection bias better than any other method. When every person has an equal chance of being picked up, their own biases do not get in the way.
Random picking means no systematic exclusion in the sample. You are not picking your favorites based on demographics or location. This fairness makes your research more trustworthy and avoids criticism of your sample.
“Simple random sampling is the least biased of all sampling techniques, providing each member of the population with an equal probability of being selected.”
Your results are more believable because people trust the impartial-selection process. This is important when sharing your findings with skeptics or regulatory bodies.
Simplicity in Design and Implementation
Compared to other methods, simple random sampling is remarkably straightforward for planning and performing. You do not have to split your population into groups or manage the complex sampling stages.
This simplicity saves a significant amount of time when designing the research. You can focus on other important things such as making your questions, collecting data, and planning your analysis.
The ease of doing so also means fewer mistakes. With fewer steps, there is less room for error that can reduce the validity of the sample.
Compatibility with Statistical Analysis Methods
Most statistical tests assume a simple random sampling. When using this method, one meets the foundational assumptions of tests such as t-tests and ANOVA without extra work.
This makes the analysis easy and follows the scientific rules. Standard formulas for confidence intervals and the margin of error can be used without additional corrections.
- Standard error calculations work directly without modifications
- Hypothesis testing procedures apply cleanly to your data
- Statistical software packages handle the analysis seamlessly
- Textbook formulas and examples match your research design
Using simple random samples is mathematically elegant. This gives you confidence in your statistical conclusions and makes it easier to interpret the results.
Easy to Understand and Explain
People, including those unfamiliar with research, can readily grasp the idea of random selection. You do not have to explain complex sampling strategies.
This clarity boosts the credibility of the research with non-technical people. When you say “everyone had an equal chance of being selected,” people understand the fairness of your method.
It is also easier to train research assistants or fieldworkers. They can quickly learn how to pick participants and do so correctly with little supervision.
Notable Disadvantages of Simple Random Sampling
Despite its strengths, simple random sampling can be difficult or impossible to use in some studies. These disadvantages of simple random sampling require careful consideration before selecting this method. Knowing the limitations of simple random sampling helps in anticipating problems and looking for other ways when needed.
Requires Complete Population List
A comprehensive sampling frame that includes every member of the target population is required. This is a significant problem when studying large, spread-out, or hidden populations.
Many populations do not have a complete list. Studying homeless people, undocumented immigrants, and those with stigmatizing conditions is very difficult.
Even when lists exist, they may be outdated, incomplete, or protected by privacy laws. Organizations often do not share member directories, and public records can contain gaps or errors that affect the quality of the sampling frame.
“The biggest practical limitation of simple random sampling is the difficulty of obtaining the name of every member of the target population.”
Can Be Time-Consuming and Costly
Random selection can scatter the sample members across large areas. This creates substantial logistical challenges that increase the research budget and extend the research timeline.
When randomly selected participants are far apart, travel becomes expensive. A single interview may require hours of driving or phone calls.
| Cost Factor | Impact on Budget | Time Requirement |
| Travel expenses | Can increase costs by 200-400% | Multiple days per interview |
| Communication attempts | Phone and mailing costs multiply | Several contact rounds needed |
| Scheduling coordination | Administrative time expenses | Weeks of back-and-forth |
The disadvantages of simple random sampling are clear when comparing costs to more efficient methods, such as cluster sampling, that keep participants together.
Risk of Underrepresenting Small Subgroups
Random chance might not provide minority groups with sufficient representation in the sample. If a subgroup is small, you might not have enough members to draw conclusions.
This is a problem when comparing different groups or ensuring diverse views of the findings. A random sample may have too few members from ethnic minorities, younger people, or rural areas.
The underrepresentation is not due to bias in your method; it is just a result of chance. However, it can cause issues when people expect their research to show all population segments.
Geographical Dispersion Challenges
When randomly selected participants are spread across vast territories, data collection becomes much more difficult. You face challenges in coordinating schedules, managing fieldworkers, and maintaining research quality across distant places.
Collecting data face-to-face is expensive and time consuming. You may need to hire local interviewers in many places, which adds to the complexity.
- Transportation costs escalate with distance coverage
- Time zones complicate scheduling and coordination
- Regional variations may require protocol adaptations
- Response rates often decline with geographic distance
These geographical challenges are some of the greatest limitations of simple random sampling in real-world research. Many researchers have used other methods to overcome these problems.
Choosing simple random sampling means weighing the good points against the bad. Think about your study’s specific needs, resources, and goals before deciding. Sometimes, theoretical benefits do not outweigh the practical issues that you will face.
Simple Random Sampling vs. Stratified Random Sampling
Choosing simple random sampling and stratified random sampling is key to good research. Both use random selection, but they select the participants differently. Knowing the differences helps in selecting the correct method for the study.
Simple random sampling treats all of the same. Everyone has an equal chance of being picked up. Stratified random sampling first split the population into groups.
What you choose depends on the population and research goals. You also need to think about how precise your results are. Let us examine the main differences and help you make decisions.
Understanding the Core Methodological Differences
Simple random sampling and stratified sampling differed mainly in their selection of participants. Simple random sampling provides everyone with an equal chance without grouping. You pick a number for each person and then choose the sample.
Stratified random sampling was different. First, the population is split into mutually exclusive subgroups called strata, based on traits such as age or income. Then, you select the participants from each group to ensure that everyone is represented.
The table below shows how these differences work in practice:
| Characteristic | Simple Random Sampling | Stratified Random Sampling |
| Population Treatment | Treats population as one homogeneous group | Divides population into distinct subgroups (strata) |
| Selection Process | Random selection from entire population at once | Random selection performed separately within each stratum |
| Subgroup Representation | Not guaranteed; depends on random chance | Guaranteed through proportional or equal allocation |
| Prior Knowledge Required | Minimal information about population needed | Requires detailed knowledge of population characteristics |
| Statistical Precision | Good for overall population estimates | Superior precision for both overall and subgroup estimates |
Another significant difference was the sampling frame requirement. Simple random sampling requires a list of people in a population. Stratified sampling requires a list plus information about each member’s stratum characteristics.
Choosing between these methods also depends on how complex and time-consuming the study is. Simple random sampling is both quick and easy to perform. Stratified sampling requires additional planning to ensure that each group is well represented.
Cost is another factor. Simple random sampling is often cheaper because the participants can be anywhere. Stratified sampling can be more cost-effective if the focus is on easier-to-reach groups.
Situations That Call for Simple Random Sampling
Simple random sampling was used when the population was homogeneous. If all participants in your study are similar, you do not need to divide them into groups.
This method is best when you do not know much about the population structure. If the population cannot be divided into meaningful groups, simple random sampling is a good choice.
Choose simple random sampling in these situations.
- Time constraints: When you need data fast and can’t plan for stratification
- Exploratory research: For initial studies to understand overall trends, not subgroup differences
- Limited resources: When your budget is tight and you can’t afford to sample from multiple groups
- Small populations: When your total population is small, simple random sampling might capture diversity well
- Uniform populations: When studying groups like employees at one location or students in one grade level
Simple random sampling is also effective when there is no need to compare the subgroups. If you only want overall estimates and do not plan to analyze demographic differences, this method is fine.
This approach is useful for quality control purposes. Testing products from a production line can use simple random sampling to obtain good results without excessive complexity.
Another benefit is its mathematical simplicity. Calculating the confidence intervals and margins of error is easier using simple random samples. This simplifies the analytical phase.
Scenarios Where Stratified Random Sampling Excels
Stratified random sampling is used when the population has distinct subgroups with different characteristics that matter to the study. If you know these subgroups and they relate to your study, stratification improves the results.
This method is crucial when precise estimates are required for each subgroup. If the outcomes are compared across different groups, stratification ensures that each group is well represented.
Stratified random sampling is best in these situations.
- Diverse populations: When studying groups with clear differences that affect your research
- Minority representation: When small but important groups might be missed by simple random sampling
- Proportional accuracy: When you need your sample to mirror the population’s composition
- Subgroup analysis: When comparing results between groups is a main goal
- Variance reduction: When certain characteristics create high variability and you want to control it
This approach is significant in political polling and market research. This ensures representation across different groups, such as age and income.
Stratified sampling is also effective when subgroup sizes vary dramatically within the population. If one group is much larger than the others, simple random sampling might not be sufficient from the smaller groups.
Stratification is also useful when some groups are difficult to reach. By proportionally or optimally sampling across groups, we obtained better results than simple random sampling.
Creating Hybrid Approaches for Enhanced Results
You do not have to select a single method. Many researchers have mixed them to obtain the best of both worlds. This hybrid approach often yields superior results in complex studies.
The most common mix uses stratified sampling as the base, and then adds simple random sampling within each group. First, the population was divided into subgroups based on the important traits. Then, randomly select participants from each group to ensure that everyone is represented.
This mix offers many benefits. It combines the precision of stratification with the simplicity of random selection within the groups. Your sample is more representative, and accurate statistical inferences can be made.
Consider this hybrid method when:
- Your population has clear divisions but also a lot of diversity within each group
- You want to ensure minority representation while keeping selection unbiased within categories
- You need both overall and subgroup-specific estimates with high precision
- Your research design requires statistical comparisons between strata
Another effective mix involves using stratification for major demographic categories, and then applying proportional allocation. For example, you might stratify by region first, and then use simple random sampling within each area to select the participants.
The key to successful hybrids is careful planning during the research-design phase. Identify key population characteristics, create strata, and allow randomness to work within those boundaries. This balanced approach often yields reliable and accurate results.
How to Analyze Simple Random Sampling Data
After collecting data from a random sample, we need to understand what it shows. This process converts raw data into useful insights. It helps make informed decisions based on evidence.
Statistical methods help guess the entire group from the sample. Even with random sampling, there are always some errors. However, the correct methods can handle this uncertainty.
Preparing Your Data for Analysis
Before starting, clean and organize the data. This step is key to avoiding mistakes in the analysis.
First, check for errors such as incorrect ages or typographical errors. For example, if you find an age of “250,” it is wrong. In addition, we searched for duplicate entries.
We then decide how to handle the missing data. You may ignore it, use averages, or use more complex methods. Always explain your choices.
Make sure that your categorical data are correctly coded. For example, use numbers for education level. Tools such as SPSS or R were used to simplify the analysis.
Applying Descriptive Statistics to Your Sample
Descriptive statistics summarize the data. They show what you found in your sample before making larger guesses.
Find the mean, median, and mode to understand the typical values. The mean was good for most of the data. The median is better for skewed data. This mode showed the most common values.
Looking at variability, as well. The standard deviation shows how spread out the data is. Range and variance provide more insights on this topic.
For categorical data, frequencies and percentages were examined. For example, if 360 out of 600 employees were happy, that is, 60%. These numbers provided a clear view of the sample.
Using Inferential Statistics for Population Estimates
Inferential statistics help guess the entire group from the sample. These account for errors in guessing.
Simple random sampling allows us to guess about a specific group. This method is based on chance, which is suitable for making guesses.
Calculating Confidence Intervals
The confidence intervals provide a range in which the true value might be. Instead of saying “the mean is 75,” you say “we’re 95% sure it’s between 72 and 78.”
The formula for the confidence interval is the Sample Mean ± (Critical Value × Standard Error). The critical value is usually 1.96 with 95% confidence. Standard error is the sample standard deviation divided by the square root of the sample size.
For example, if a sample of 400 customers has a mean score of 7.5, then the standard error is 0.1. Your 95% confidence interval was 7.5 ± (1.96 × 0.1) = 7.3–7.7.
This means that you are 95% sure the true average score is between 7.3 and 7.7. Larger samples yielded more precise estimates.
Determining Margin of Error
The margin of error shows the precision of the estimates. Polls often show this as “52% support, with a margin of error of ±3%.”
To find the margin of error, we used the following formula: Margin of Error = Critical Value × Standard Error. The standard error formula is √[p(1-p)/n], where p is the sample proportion and n is the sample size.
If 520 out of 1,000 voters support a candidate, the standard error is 0.0158. With a 95% confidence level, the margin of error is 1.96 × 0.0158 = 0.031, or approximately 3.1%. This means that true support likely falls between 48.9% and 55.1%. Smaller margins require larger samples, which is why large polls have more than 1,000 people
Hypothesis Testing with Simple Random Samples
Hypothesis testing checks whether the differences in the sample are real or chance. This method assumes that the data are obtained from a simple random sample.
We start with a null hypothesis (usually “no difference”) and an alternative hypothesis (“a difference”). Choose the correct test for your data and questions. Set your significance level, usually 0.05, which means you will accept a 5% chance of incorrect conclusions.
T-tests were used to compare means between groups. An independent samples t-test was used for the average scores between the two departments. A paired sample t-test was used for the before-and-after measurements from the same people.
Chi-square tests were used to check whether the categorical data relationships were real. Test whether gender and product preference are independent or if the observed frequencies differ from expected.
Analysis of Variance (ANOVA) was used to compare means across three or more groups. It is better than running many t-tests to see if differences exist among departments, age groups, or treatment conditions.
After calculating the test statistic, compare it to critical values, or look at the p-value. If the p-value is less than 0.05, there is sufficient evidence to say that a statistically significant difference exists in the population.
| Statistical Method | Data Type | Primary Use | Sample Requirement |
| Descriptive Statistics | Numerical or Categorical | Summarize sample characteristics | Any sample size |
| Confidence Intervals | Numerical | Estimate population parameters with precision range | Minimum 30 observations |
| T-test | Numerical (continuous) | Compare means between two groups | Minimum 30 per group recommended |
| Chi-Square Test | Categorical | Test relationships between categorical variables | Expected frequency ≥5 per cell |
| ANOVA | Numerical (continuous) | Compare means across three or more groups | Minimum 30 per group recommended |
Recall that statistical significance does not always mean that the difference is important. Always think about your research goals and real-world implications when interpreting results.
Common Challenges and Limitations of Simple Random Sampling
Simple random sampling looks good on paper but faces real-world problems. These issues can be tough on resources and test problem-solving skills. Knowing the limitations of simple random sampling helps you plan better and find ways to reduce their impact.
Each research method has its own trade-offs. Knowing these challenges helps to effectively use this method. The problems faced depend on the population, goals, and resources.
Sampling Frame Accessibility and Completeness Issues
The first big challenge is to obtain a complete list of the target population. This list is called the sampling frame.
However, obtaining a complete list is difficult for many populations. Think about trying to find everyone in groups such as homeless people, undocumented immigrants, or those with rare diseases.
However, even easy-to-reach groups have problems. Employee lists might be old, student registries miss part-time students, and customer lists may have duplicates. Your sampling frame may have missed some people.
When your sampling frame is incomplete, you get a coverage bias immediately. People not on your list cannot be chosen, which contradicts the idea that everyone should have an equal chance.
Checking the quality of the sampling frame is crucial. Look for missing groups, old information, and duplicates. Sometimes you have to accept these limits. If you can only reach 85% of your population, your findings apply to that group, not to the whole population.
Dealing with Non-Response and Missing Data
Even with random selection, not everyone participated in the study. Some will not answer your survey, refuse to join, or cannot be found.
This creates a big problem: non-response bias. If those who do not respond are different from those who do, the data will not truly represent the population.
Among the disadvantages are difficulty gaining access to respondents, which can be drawn from the larger population, greater time, greater costs, and bias can occur under certain circumstances.
Imagine a health survey with busy professionals and retirees. Retirees might have had more time, while professionals might have ignored it. Your results show what retirees think, even though you picked them randomly.
To fight non-responses, reminders are sent by email, phone, and mail. Offer rewards, such as gift cards or donations to your cause.
Keep track of the number of people responding. If it was over 30-40%, responders and non-responders were compared. This helps you see whether your data are biased.
Obtaining people for participation was difficult. Explain why your research matters, promise to keep their information private, and make it easy for them to participate.
Managing Cost and Time Constraints
Simple random sampling is more expensive than the other methods. Your participants may have been far away, costing a lot to reach.
Traveling to see people is expensive. Imagine visiting 500 people across the state. This takes a lot of time and money.
Phone surveys seem cheaper, but calling people repeatedly costs more. Online surveys are cheaper but leave people without the internet. Mail surveys cost money for printing, postaging, and processing.
Time is also a problem. Finding and talking to people take longer than surveying easy-to-reach groups. Your project may take weeks or months.
Researchers with tight budgets must be chosen carefully. You might need to cut the sample size, use cheaper methods, or find more money. The goal is to make smart choices while keeping research solid.
| Challenge Type | Impact on Research | Mitigation Strategy | Cost Implication |
| Incomplete sampling frame | Coverage bias, reduced validity | Frame quality assessment, acknowledge limitations | Low to moderate |
| High non-response rates | Non-response bias, smaller effective sample | Multiple follow-ups, incentives, convenience | Moderate to high |
| Geographic dispersion | Increased travel time and expenses | Remote data collection, local assistants | High |
| Large population size | Overwhelming logistics, budget strain | Consider cluster sampling, adequate funding | Very high |
Overcoming Practical Implementation Difficulties
Simple random sampling has several practical problems. However, these issues require creative solutions. The two major problems are geographic and population size issues.
Geographic Distribution Problems
Random selection does not consider the locations where people live. Your sample might include people in distant places or even other countries.
This geographic distribution makes this difficult to achieve. How do you interview someone who is far away? What if they live in places with bad Internet or no mail service?
There are several methods to solve these problems. Phone interviews work if everyone has a phone. Online surveys are cheap but exclude those without the Internet. Using local helpers in different places can save both time and money. Video calls offer a middle ground for face-to-face conversations without traveling.
Sometimes you cannot reach a few people. Making sure to document these cases. Try to replace them with more people from the same area.
Population Size Considerations
The size of the population affects simple random sampling. Sampling 500 people out of 5,000 is easy. However, sampling 500 people from 5 million is much more difficult.
Large populations make it difficult to obtain a good sampling frame. We attempted to sample all Californians (over 39 million people). No single list has been completed.
Large populations also mean that your sample is spread out. This makes it difficult to find people in convenient groups. The chance of picking people in clusters decreases as the population increases.
Simple random sampling may not be effective for large populations. Cluster sampling and multistage sampling were better. They keep your sample random but make it easier to collect data.
A sampling error can occur if the sample does not show what the population is like. This is likely to have a large population and practical limits. Your goal was to reduce these errors as much as possible. Knowing these practical difficulties does not mean abandoning simple random sampling. It means being realistic, planning well, and having backup plans for the challenges you will face.
Conclusion
Simple random sampling is the key to this research. You now know why this was important. This ensures that everyone has an equal chance of being picked up.
The creation of a simple random sample requires careful planning. You need a complete list, sufficient resources, and clear goals. This method is reliable for ensuring that the findings apply to all.
Your goals will help you choose how to sample. Simple random sampling is best when you have a list and enough money. Use other methods in different groups or places.
Simple random sampling is strong, because it is fair and sound. This is beneficial for many studies, such as medical tests or school research. This gives you the results that you can trust.
Thinking about the challenges and benefits of simple random sampling. This strengthens our research. Use these ideas to obtain good results in your field.
FAQ
What is simple random sampling in research methods?
Simple random sampling is a method for selecting a group of people for a study. Every person in the group had an equal chance of being chosen. It is considered the best way to pick a group because it is fair and does not allow people to choose who to pick.
This method is used in many fields such as health, education, and social sciences. This helps to ensure that the study is reliable and can be applied to many people.
What two conditions must be satisfied by a simple random sample?
A simple random sample must satisfy two main rules. First, every person in the group must have an equal chance of being selected. For example, if you have 1,000 people and want to select 100, each person has a 10% chance. Second, selecting one person should not change the chance of selecting another person. These rules ensure that a group is truly random and fair.
What is the difference between a random sample and simple random sample?
Random and simple random samples are often confused. But they are different. A random sample is any group picked using a method that gives everyone a chance to be chosen, and a simple random sample is a specific type in which every person has an equal chance and picks are independent. It treats everyone as one group without dividing them into smaller groups.
What is the difference between simple random sampling and stratified random sampling?
Simple random sampling treats the entire group as one group. Stratified random sampling divides a group into smaller groups based on certain traits, and simple random sampling is used when the group is mostly the same. Stratified sampling was used when there were significant differences in the group.
What are the primary advantages of simple random sampling?
Simple random sampling offers four major benefits. First, it is fair and unbiased. It does not allow personal choices or ease of access to affect who is selected. Second, it is easy to set up and perform. This method does not require complex steps or groups. Third, it works well with several statistical tests. This makes it easy to analyze and understand the data. This makes it clear and trustworthy to others.
What are the main disadvantages of simple random sampling?
However, simple random sampling has certain disadvantages. First, a complete list of everyone in the group was required. Second, it can be expensive and take a lot of time consuming. This is because people may be far apart. Third, it might not pick enough people from small groups, and finally, it can be difficult to reach people from different places. This makes the process more expensive and complicated.
How do you conduct simple random sampling step-by-step?
To perform simple random sampling, we followed six steps. First, clearly define who is in your group. Second, make a list of everyone in the group. Third, decide how many people need to pick up. Fourth, give each person a number to pick, and fifth, pick your group using random numbers. Sixth, we contacted and obtained data from the selected participants. Make sure to follow up with those who do not answer the question.
Can you provide examples of simple random sampling in research?
Below are some examples of simple random sampling in different fields. In health research, a study might select 1,200 adults from a list to ask about their health behaviors. In education, a university might select 500 students from a list to inquire about campus services, for example. In manufacturing, a factory may pick 100 light bulbs to test quality, and in corporate settings, a company may pick 200 employees for in-depth interviews. For customer service, a business may select 300 customers for feedback surveys. In medical research, patients may be selected from a hospital database for treatment studies.
Why is simple random sampling important in research?
Simple random sampling is important for three reasons. First, it ensured that the study was fair and unbiased. It does not allow personal choices or ease of access to affect who is selected, and it helps ensure that the study is representative of the whole group. This is important to obtain accurate conclusions. Third, it provides a solid basis for the statistical analysis. This makes it possible to draw conclusions about the entire group based on a smaller sample.
How do you analyze simple random sampling data?
To analyze the simple random sampling data, we followed several steps. First, we get your data ready by checking for mistakes and missing information; second, we use descriptive statistics to understand what you found. This includes means, medians, and frequencies. Third, statistical tests were used to draw conclusions regarding the entire group. This included confidence intervals and hypothesis testing.
What is probability simple random sampling?
Probability simple random sampling is based on math. This means that one can calculate the exact chance of someone being picked. For example, if 100 out of 1, 000 people are selected, each person has a 10% chance, which makes the method fair and reliable. This allows you to draw conclusions about the whole group with confidence.
What are common limitations of simple random sampling?
However, simple random sampling presents several challenges. First, a complete list of everyone in the group was required. Second, it can be expensive and take a lot of time consuming. This is because people may be far apart. Third, it might not pick enough people from small groups, and finally, it can be difficult to reach people from different places. This makes the process more expensive and complicated.
When should you use simple random sampling versus stratified sampling?
Simple random sampling was used when the groups were mostly the same. It is easy to set up and does not require complex steps or groups to be formed. Stratified sampling was used when significant differences were observed between groups. This ensured that all groups were represented. You can also mix both methods for the best of both the worlds.
Read more