
Data Visualization tools
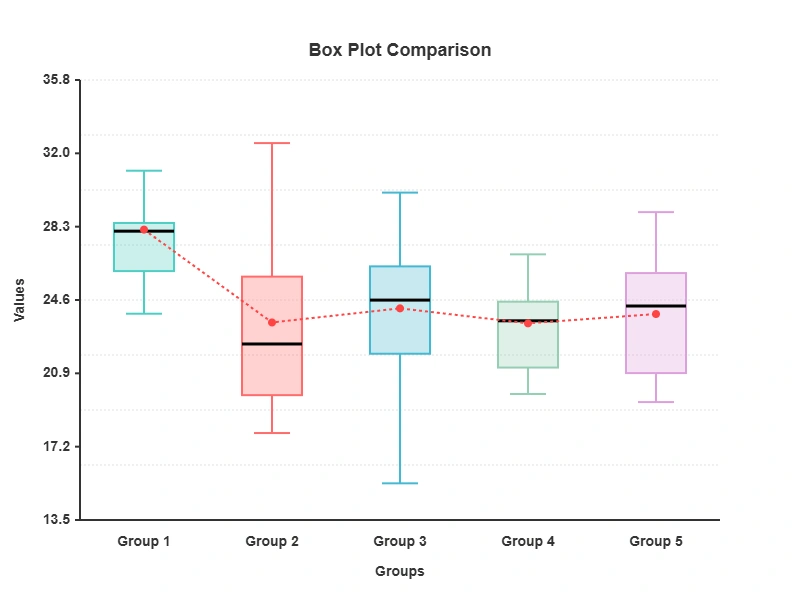 Box and Whisker Plot Maker
An interactive web tool for creating professional statistical visualizations including box plots, violin plots, mean plots, and median plots. Features real-time data input, customizable styling, outlier detection, and export capabilities in multiple formats (PNG, PDF, SVG).
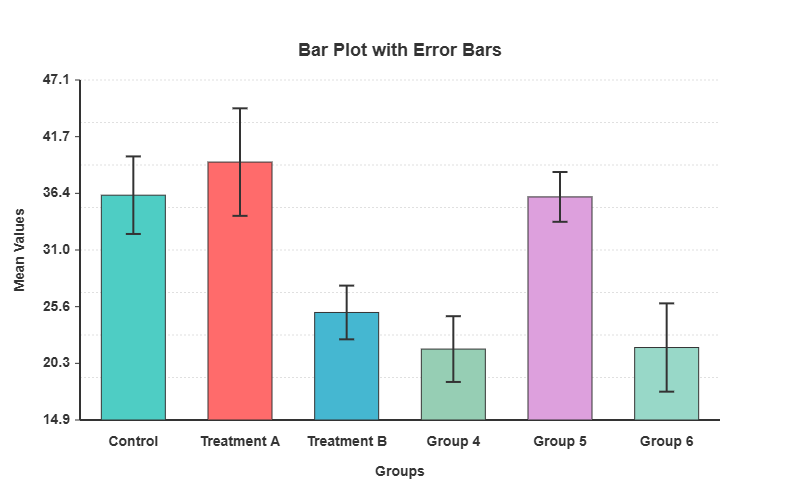 Bar Plot with Error Bars Generator
Create professional bar charts with error bars instantly - just input your data and customize colors, labels, and statistical displays.
Perfect for researchers, students, and professionals who need quick, high-quality visualizations with downloadable results.
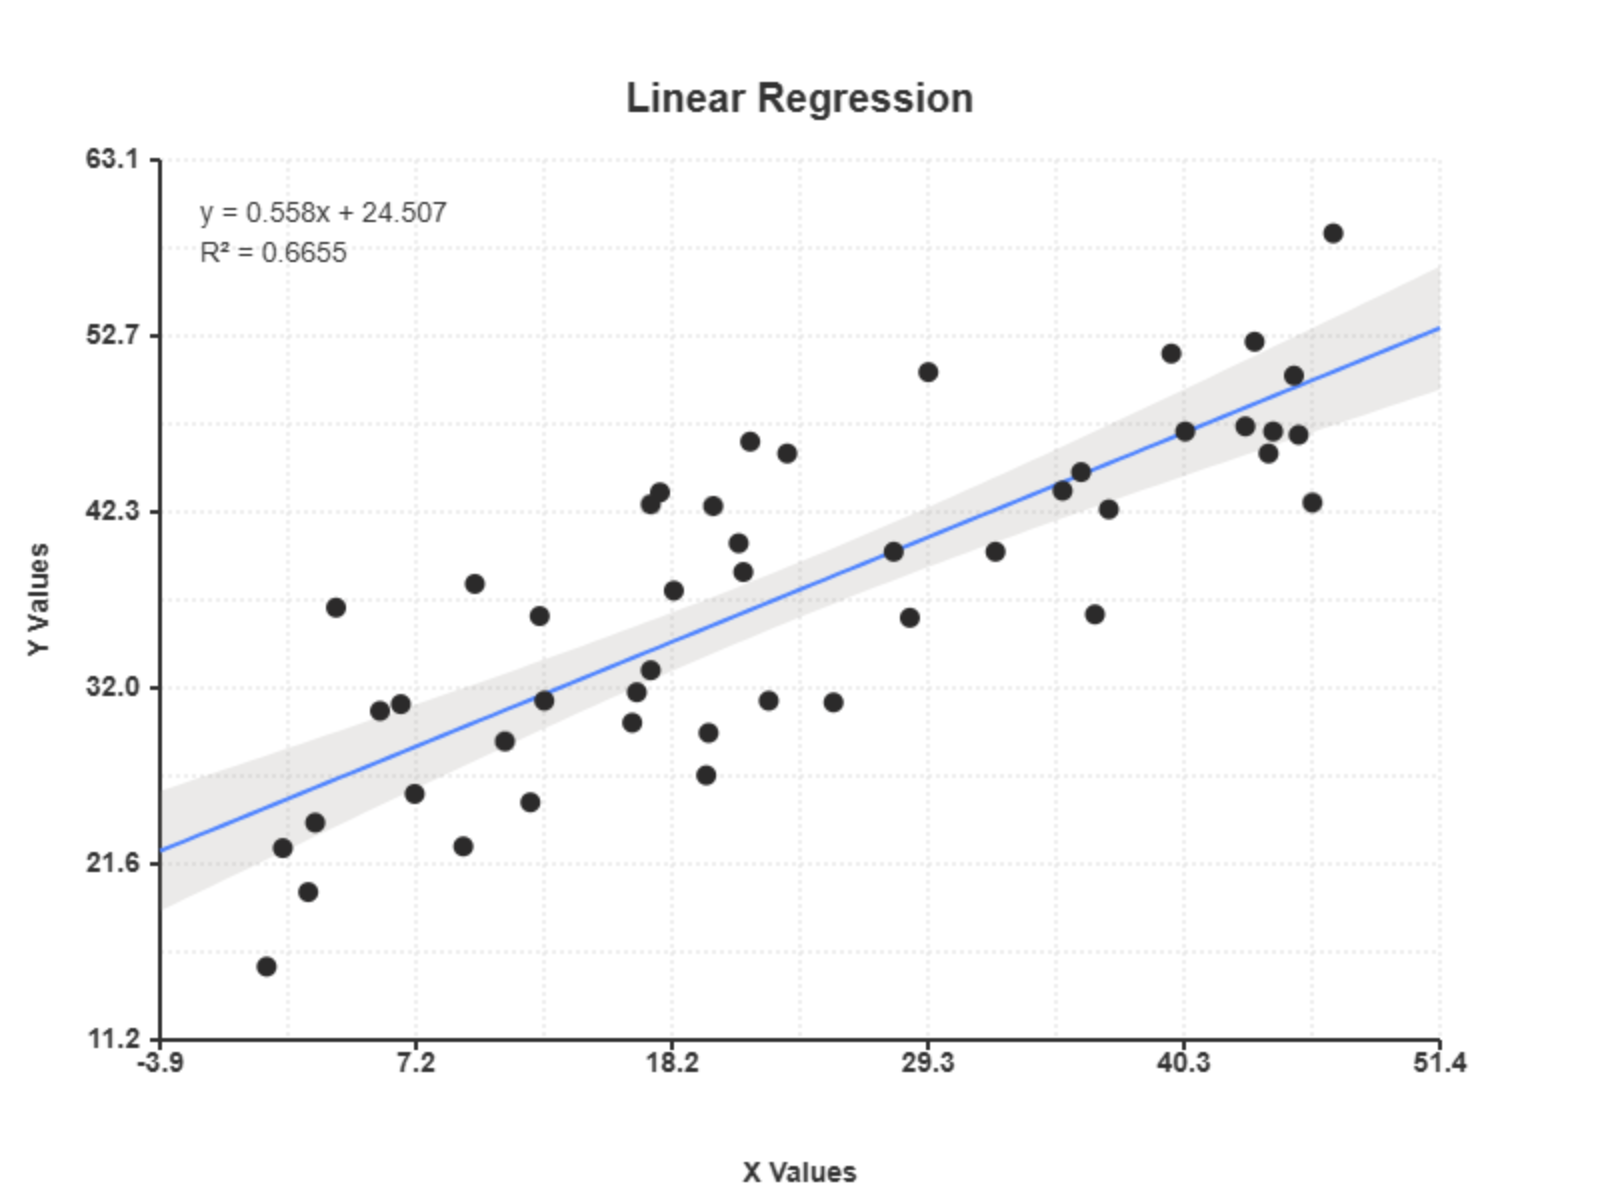 Linear Regression Scatter Plot Generator
A scatter plot is a type of data visualization that uses dots to represent the values obtained for two different variables. Scatter plots are primarily used to observe and visually display the relationship, or correlation, between two quantitative variables.
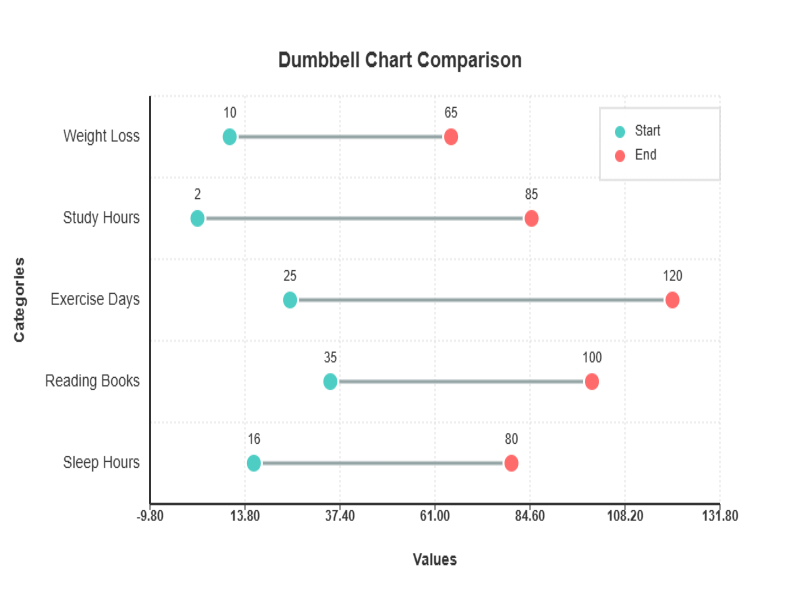 Dumbbell Chart Generator
A dumbbell chart is a data visualization designed to highlight the change or difference between two connected data points. It resembles a set of dumbbells, hence the name. Each "dumbbell" consists of two dots (or other markers) representing two values, connected by a line that emphasizes the gap between them.
Free Data Visualization Tools