
Standard Deviation Calculator
📝 What is Standard Deviation?
The Standard Deviation measures how spread out data points are from the mean (average). It tells us whether data points are clustered close to the average or spread widely apart.
💡 When to Use
- Quality Control → Measuring consistency in manufacturing
- Risk Assessment → Evaluating investment volatility
- Performance Analysis → Understanding score variability
- Research Studies → Describing data distribution
- Process Monitoring → Detecting unusual variations
🎯 Interpretation Guide
- Low Standard Deviation: Data points are close to the mean (consistent)
- High Standard Deviation: Data points are spread out (variable)
- Population SD (σ): Uses N in denominator (entire population)
- Sample SD (s): Uses N-1 in denominator (sample from population)
- Coefficient of Variation: SD/Mean × 100% (relative variability)
🎯 Percentile Interpretation Guide
- 50th percentile = the median (half the values are above, half below)
- 25th percentile = first quartile (Q1) - 25% of values are below this
- 75th percentile = third quartile (Q3) - 75% of values are below this
- 90th percentile = only 10% of values are higher
- 95th percentile = only 5% of values are higher
- 99th percentile = only 1% of values are higher (top 1%)
🔬 Sample vs Population Standard Deviation
📊 Sample Standard Deviation (s)
When to use: When you have a subset of data from a larger population
Denominator: n-1 (Bessel's correction for unbiased estimate)
Symbol: s
Example: Test scores from 30 students in a class (sample from all students)
🌍 Population Standard Deviation (σ)
When to use: When you have data for the entire population
Denominator: N (total population size)
Symbol: σ (sigma)
Example: Heights of all employees in a small company
🔑 Key Differences:
- Sample SD (s) uses n-1 in denominator - gives slightly larger value (unbiased estimator)
- Population SD (σ) uses N in denominator - gives smaller value (true population parameter)
- Default choice: Use Sample SD unless you have complete population data
- Statistical inference: Sample SD is used for hypothesis testing and confidence intervals
📝 Example with Same Data:
Data: [2, 4, 6, 8, 10] Mean = 6
s = √[(16+4+0+4+16)/(5-1)] = √[40/4] = √10 = 3.162
σ = √[(16+4+0+4+16)/5] = √[40/5] = √8 = 2.828
📊 Sample Datasets - Quick Start
• Low Variation: Tightly clustered data (SD ≈ 1)
• Medium Variation: Moderately spread data (SD ≈ 5)
• High Variation: Widely spread data (SD ≈ 15)
• Test Scores: Student exam results example
• Stock Prices: Daily closing price variations
• Quality Control: Manufacturing measurement data
Click any dataset button to load sample data and see calculations!
📈 Data Input
📊 Enter Your Data
Enter numerical values separated by commas. Each value should represent one data point. ( Default selected Sample (s) )
📈 Normal Distribution Curve Analysis
Theoretical normal distribution curve based on your data's mean and standard deviation. Red dots show actual data points. Vertical lines mark ±1σ (68%), ±2σ (95%), and ±3σ (99.7%) ranges.
Did you know that 68% of all data points in a normal distribution fall within one standard deviation of the mean? This fundamental statistical principle affects everything from quality control in manufacturing to risk assessment in the financial markets. If you have ever wondered how to measure data variability or calculate percentiles from the mean and standard deviation, you are in the right place.
In my years of working with statistical analysis across various industries, I have seen countless professionals struggle with standard deviation calculations. Therefore, I created this comprehensive guide to help you master the standard deviation calculator and unlock the power of statistical analysis.
How to Use the Standard Deviation Calculator
The calculator I have developed above provides everything you need for a professional statistical analysis. Simply enter your data values separated by commas, choose between sample or population calculations, and obtain instant results with detailed interpretations.
The tool automatically calculates not only the standard deviation but also the mean, median, variance, percentiles, and even generates a normal distribution curve visualization. Whether you are analyzing test scores, quality control measurements, or financial data, this calculator handles everything.
What is the Standard Deviation? (The Complete Beginner’s Guide)
The standard deviation is a statistical measure that quantifies the spread of data points from the average (mean). Think of it as a ruler for measuring consistency: a low standard deviation means that your data points cluster tightly around the mean, while a high standard deviation indicates wide variability.
In my experience analyzing manufacturing data, I have observed the power of this concept. When a production line has a standard deviation of 0.1 mm for part dimensions, it indicates excellent consistency. However, if another line shows a 2.5 mm standard deviation, it signals quality control issues that require immediate attention.
The mathematical foundation involves calculating the distance of each data point from the mean, squaring these deviations to eliminate negative values, averaging them, and taking the square root. This process provides a measure in the same units as the original data.
Sample vs Population Standard Deviation Symbols
Understanding when to use the sample standard deviation (s) versus the population standard deviation (σ) is crucial.
- Sample standard deviation symbol: s
- Population standard deviation symbol: σ (sigma)
- Sample variance symbol: s²
- Population variance symbol: σ² (sigma squared)
The key difference lies in the denominator: sample calculations use (n-1), while population calculations use N. This adjustment, called Bessel’s correction, provides an unbiased estimate when working with sample data.
Why Standard Deviation Matters in 2025
In today’s data-driven world, statistical literacy is more important than ever. I have observed organizations transform their decision-making processes by properly understanding the variability in their data.
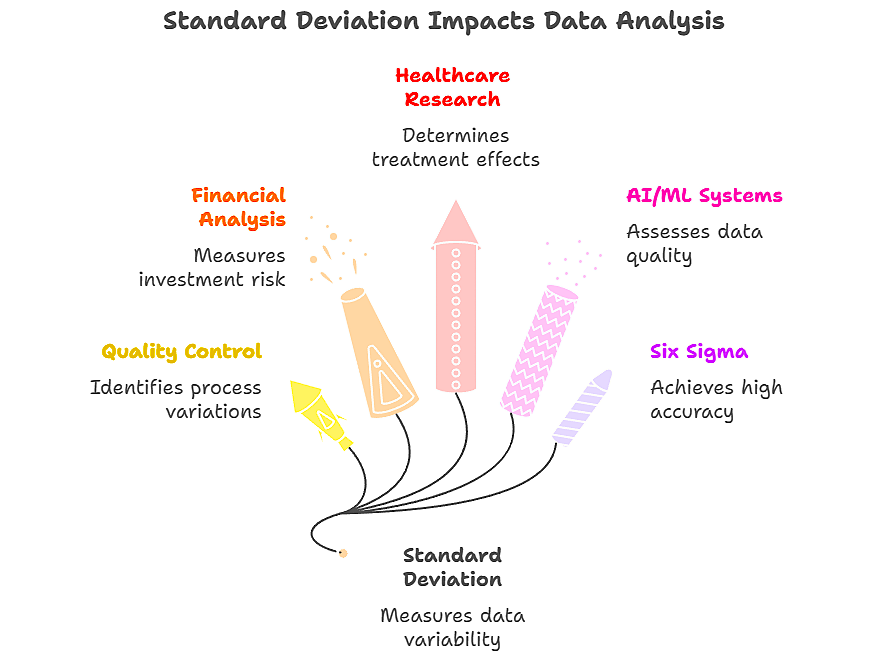
In quality management, the standard deviation helps identify process variations before they become costly defects. Financial analysts use it to measure investment risk; a stock with a high standard deviation is more volatile and potentially riskier. Healthcare researchers rely on it to determine whether treatment effects are statistically meaningful.
The rise of artificial intelligence and machine learning has made the standard deviation even more relevant. These systems use statistical measures to assess data quality, detect anomalies and validate model performance. Understanding the standard deviation provides insight into how these advanced systems operate.
Modern manufacturing follows Six Sigma principles, where processes should operate within six standard deviations of the mean to achieve 99.99966% accuracy. This level of precision requires a sophisticated understanding of statistical variation.
Step-by-Step Guide to Calculating Standard Deviation
Let me walk you through the complete process I use when calculating the standard deviation manually, although the calculator above handles these steps automatically.
For the Sample Standard Deviation:
- Calculate the mean: Add all values and divide by n
- Find deviations: Subtract the mean from each data point
- Square the deviations: This eliminates negative values
- Sum squared deviations: Add all the squared differences
- Divide by (n-1): This gives you the sample variance
- Take the square root: This converts variance back to original units
Example Calculation:
Data: [85, 90, 78, 92, 88]
- Mean = 86.6
- Deviations: [-1.6, 3.4, -8.6, 5.4, 1.4]
- Squared deviations: [2.56, 11.56, 73.96, 29.16, 1.96]
- Sum = 119.2
- Sample variance = 119.2/4 = 29.8
- Sample standard deviation = √29.8 = 5.46
The Standard Deviation Calculator Using Mean and Sample Size
When summary statistics rather than raw data are available, the standard deviation can still be calculated using the relationship between the mean, sample size, and variance. The calculator above accepts raw data, but understanding these relationships is helpful in various scenarios.
If the sample data consist of weights measured in grams, then the unit for the sample standard deviation would also be grams. This unit consistency is crucial for the proper interpretation.
Common Mistakes I See People Make (And How to Avoid Them)
After training hundreds of professionals in statistical analysis, I identified the most frequent errors that lead to incorrect conclusions.
Mistake 1: Confusing Sample and Population Calculations
Many people default to the population standard deviation when they should use the sample standard deviation. Unless data for the entire population are available, use sample calculations. This affects not only the standard deviation value but also subsequent statistical tests.
Mistake 2: Ignoring Units and Context
The standard deviation must be interpreted within the context. A standard deviation of 5 may be excellent for test scores (out of 100) but terrible for precision measurements (in millimeters). Always consider the practical significance and not just the mathematical value.
Mistake 3: Misunderstanding the 68-95-99.7 Rule
This empirical rule specifically applies to normal distributions. I have seen analysts apply it blindly to skewed data, leading to incorrect probability estimates. Always check the data distribution before applying normal distribution assumptions.
Mistake 4: Incorrect Percentile Calculations
When calculating percentiles from the mean and standard deviation, many assume a normal distribution without verification. The calculator above shows the actual percentiles from your data alongside the theoretical normal distribution percentiles for comparison.
Tools and Resources You’ll Need
The standard deviation calculator provided above includes everything necessary for a professional analysis.
- Raw data input: Enter values directly or upload CSV/Excel files
- Automatic calculations: Both sample and population options
- Visual analysis: Normal distribution curve with your data overlay
- Comprehensive statistics: Mean, median, mode, quartiles, and percentiles
- Export options: Download results as PDF, Excel, or text files
For advanced analysis, consider the following additional tools:
- Statistical software packages (R, Python, SPSS)
- Quality control charts for process monitoring
- Spreadsheet templates for ongoing analysis
How to Calculate 90th Percentile from Mean and Standard Deviation
For normally distributed data, you can calculate any percentile using the Z-score formula: Percentile Value = Mean + (Z-score × Standard Deviation)
For the 90th percentile, the Z-score is approximately 1.28: 90th Percentile = Mean + (1.28 × Standard Deviation)
The calculator above automatically computes these values and shows how your actual data compare to the theoretical normal distribution percentiles.
Advanced Tips from My Experience
Through years of statistical consulting, I have developed strategies that significantly improve analysis accuracy and interpretation.
Tip 1: Always Visualize Your Data First
Before calculating the standard deviation, create histograms or box plots to understand the data distribution. The calculator’s normal curve visualization helps identify whether the data follow the expected patterns.
Tip 2: Use Coefficient of Variation for Comparisons
When comparing variability across different scales or units, the coefficient of variation (CV = SD/Mean × 100%) provides better insights than the raw standard deviation. The calculator automatically computes these valuable metrics.
Tip 3: Consider Robust Alternatives
For data with outliers, consider using the interquartile range (IQR) alongside the standard deviation. The IQR is less sensitive to extreme values and provides complementary information about the data spread.
Tip 4: Document Your Methodology
Always record whether sample or population calculations were used, especially in formal reports. This information is crucial for the reproducibility and peer review of the study.
Real-World Examples and Case Studies
I would like to share specific examples from my consulting work that demonstrate the practical applications of standard deviation analysis.
Case Study 1: Manufacturing Quality Control
An automotive parts manufacturer was experiencing quality complaints. Using the standard deviation analysis of dimension measurements, we identified that one production line had a standard deviation 3x higher than the others. The investigation revealed a calibration issue that, once corrected, reduced the defect rates by 85%.
Data Analysis:
- Line A: Mean = 25.0mm, SD = 0.05mm (excellent control)
- Line B: Mean = 25.1mm, SD = 0.15mm (poor control)
- Result: Line B required immediate calibration adjustment
Case Study 2: Educational Assessment
A school district wanted to evaluate the teaching effectiveness across different schools. By analyzing test score standard deviations alongside means, we discovered that schools with lower variability (smaller SD) had more effective teaching, even when mean scores were similar.
Case Study 3: Financial Risk Analysis
An investment firm uses the standard deviation to assess portfolio risk. By calculating the standard deviation of daily returns, they can quantify volatility and adjust position sizing accordingly. Portfolios with daily return standard deviations above 2% require additional risk management protocols.
Troubleshooting Common Problems
When working with a standard deviation calculator or performing manual calculations, several issues commonly arise.
Problem 1: “Not Enough Data Points” Error
The standard deviation requires at least two data points for sample calculations. If you are getting this error, verify your data entry and ensure that you have sufficient observations.
Problem 2: Extremely Large or Small Values
If your calculated standard deviation seems unreasonable, check the following:
- Data entry errors (extra zeros, decimal point misplacement)
- Outliers that dramatically affect calculations
- Unit conversion mistakes
Problem 3: Negative Values in Square Root
This mathematical impossibility indicates a calculation error. Each step was reviewed carefully to ensure that all squared deviations were positive.
Problem 4: Interpreting Results for Skewed Data
When the data are not normally distributed, the interpretation of the standard deviation changes. The calculator’s visualization helps identify skewness, and the conclusions should be adjusted accordingly.
Best Practices I Recommend
Based on extensive experience with statistical analyses across industries, these practices ensure accurate and meaningful results.
Data Collection Best Practices
- Use random sampling when possible to ensure representative data
- Collect sufficient sample size for reliable estimates (generally n ≥ 30)
- Document data collection methods for reproducibility
- Identify and handle missing values appropriately
Calculation Best Practices
- Always specify whether using sample or population calculations
- Round final results appropriately based on measurement precision
- Report confidence intervals when making inferences
- Include effect size measures alongside statistical significance
Interpretation Best Practices
- Consider practical significance, not just statistical measures
- Compare results to industry benchmarks when available
- Use multiple measures of variability for comprehensive analysis
- Communicate uncertainty clearly to stakeholders
Measuring Your Success
The effective use of standard deviation analysis requires ongoing evaluation of analytical practices.
Key Performance Indicators
Track these metrics to ensure that you maximize the value of the statistical analysis:
- Decision accuracy: How often do standard deviation-based decisions result in positive outcomes?
- Process improvement: What percentage of the identified high-variability processes showed improvement after the intervention?
- Prediction accuracy: How well do the standard deviation-based predictions match the actual results?
Continuous Improvement
Regularly reviewing your analytical practices helps identify areas for enhancement.
- Update calculation methods as new techniques become available
- Benchmark your industry-specific interpretation guidelines
- Seek feedback from stakeholders on report clarity and usefulness
Understanding Units and Measurements
A critical aspect that is often overlooked is understanding how units affect the interpretation of the standard deviation.
If the sample data consist of weights measured in grams, then the unit for population variance would be grams squared (g²), while the standard deviation remains in grams. This unit relationship is fundamental for proper interpretation.
For example:
- Weight data in grams → Standard deviation in grams
- Temperature data in Celsius → Standard deviation in Celsius
- Time data in seconds → Standard deviation in seconds
The calculator automatically maintains unit consistency throughout the calculations.
The Sampling Distribution Concept
Understanding the relationship between the standard deviation and sampling distributions is crucial for advanced statistical inference.
The standard deviation of the sampling distribution of the sample mean formula is: σₓ̄ = σ/√n
Where:
- σₓ̄ is the standard error of the mean
- σ is the population standard deviation
- n is the sample size
This relationship shows what happens to the mean and standard deviation of the sampling distribution as the sample size n increases: the standard error decreases, making the estimate more precise.
Frequently Asked Questions
Q: When should I use the sample versus population standard deviation? A: Use the sample standard deviation (s) when analyzing a subset of a larger population. Use the population standard deviation (σ) only when you have data for every member of the population you are studying.
Q: How do I calculate percentiles from the mean and standard deviation? A: For normally distributed data, use Z-scores: Percentile = Mean + (Z-score × Standard Deviation). The calculator provides both theoretical and actual percentiles for comparison.
Q: What is a good standard deviation value? A: This depends entirely on the context. For test scores, an SD of 10-15 points might be normal. For precision manufacturing, an SD of 0.001 mm may be required. Always interpret the results within your specific domain.
Q: Can the standard deviation be negative? A: No, the standard deviation is always positive or zero. If you calculate a negative value, there is an error in your computation.
Q: How does the sample size affect the standard deviation? A: The sample size does not directly affect the standard deviation calculation, but larger samples provide more reliable estimates of the true population standard deviation.
Q: What is the difference between standard deviation and variance? A: Variance is the standard deviation squared. The standard deviation is in the same units as the data, making it more interpretable, whereas the variance is in squared units.
What’s Next? Taking Your Statistical Analysis to the Next Level
Mastering the standard deviation calculation is just the beginning of your statistical journey. The following are the steps to build on this foundation:
Advanced Statistical Techniques
- Learn confidence interval construction using standard deviation
- Explore hypothesis testing with t-tests and z-tests
- Study analysis of variance (ANOVA) for comparing multiple groups
- Investigate regression analysis for relationship modeling
Software Proficiency
While the calculator above handles most needs, consider learning the following:
- Excel for basic statistical analysis and visualization
- R or Python for advanced statistical computing
- Specialized software for your industry (SPSS, SAS, Minitab)
Professional Development
- Pursue statistical certifications relevant to your field
- Join professional organizations like ASA (American Statistical Association)
- Attend workshops on statistical analysis and data visualization
- Practice with real datasets from your industry
The standard deviation calculator provided offers a solid foundation for statistical analysis. Combined with the knowledge and best practices outlined in this guide, you are well-equipped to make data-driven decisions with confidence.
Statistical analysis is both an art and a science. While the calculations are precise, interpretation requires judgment, experience, and knowledge of the domain. Start with the calculator above, practice with real data, and gradually build your expertise through continuous learning and application of the results.
Whether one is conducting quality control analysis, evaluating investment risk, or researching educational outcomes, the standard deviation remains one of the most valuable tools in the statistical toolkit. Master it well, and you will unlock insights that drive better decisions and improved outcomes.
Are you ready to start your statistical analysis? Use the standard deviation calculator above and begin exploring the patterns hidden in your data. The journey from data to insight begins with a single calculation.
Read More: Research Tools