Descriptive Statistics Calculator
Histogram Customization
Plot Customization
Are you aware that more than 90% of data analysis tasks can be simplified with the use of a descriptive statistics calculator? This tool is ideal for students bogged down in spreadsheets or business professionals seeking patterns. It enables you to swiftly determine key statistics, like the mean and standard deviation, without needing to download any software.
By simply inputting your data into an easy-to-use online tool, you can generate statistics complete with charts. This is not just a fantasy; it is a reality available to you. These calculators support multiple languages, assisting people globally. They are incredibly beneficial for students, educators, and professionals alike.
Key Takeaways
- Using descriptive statistics calculators enhances the efficiency of data analysis tasks by 90% compared to conventional methods.
- Compute measures such as the mean and standard deviation directly online.
- Free downloads TXT, PDF, XLSL, and PNG; accessible via a simple web interface.
- Provides visually informative charts to aid in data interpretation.
- It is designed for diverse users, including students, teachers, and professionals.
What Are the Calculating Descriptive Statistics?
Descriptive statistics summarize the data using numbers. They provide a quick look at the data and find patterns. This makes big data easier to understand and analyze.
Important measures included the mean, standard deviation, quartiles, and frequency tables. These help us understand how data are spread out and what is in the middle. They make data analysis easier and clearer.
Here is a detailed look at some common measures:
| Measure | Description | Example Calculation |
|---|---|---|
| Mean | The average value of the dataset is. | Sum of values / Number of values |
| Median | The middle value when the data are ordered. | Middle value in ordered list |
| Mode | The most frequently occurring value is. | Most frequent value |
| Standard Deviation | It measures the amount of variation in the dataset. | √(Σ (x – mean)² / N) |
Knowing how to calculate descriptive statistics helps us gain deeper insights. This will lead to better decisions and analyses in the future.is.
How to Use a Descriptive Statistics Calculator
A descriptive statistics calculator was used enableles users to calculate key descriptive statistics and visualize the data using histograms and box plots. It supports manual data entry, CSV/Excel uploads, theme customization, and multiple download/export options.
1. Input Options
Data can be input in one of two ways:
Option A: Manual Entry
- Use the text area box labelled “Enter comma-separated values.”
- Example: 45, 60, 60, 45, 57, 34, 46, 35, 45, 58
- You may enter as many numeric values as needed, separated by commas.
Option B: Upload File
- Use the “Choose File” button to upload the. csv or .xlsx file.
- Once uploaded, a dropdown will appear to allow you to select the numeric column you want to analyze.
- The numeric values of the selected column are automatically added to the input box.
2. Dark Mode
Enable Dark Mode by checking the box labelled “Dark Mode” for a darker, eye-friendly theme.
3. Calculating Statistics
- Click the “Calculate” button to compute a full set of descriptive statistics, including:
- Mean, Median, Mode
- Standard Deviation, Variance
- Quartiles (Q1, Q2, Q3), Range, IQR
- Skewness, Kurtosis, Z-scores
- Confidence Interval, MAD, CV
- Geometric & Harmonic Mean, Trimmed Mean
- Frequencies and Sum of Squares
- The results will be displayed in a formatted statistical table.
4. Plot Customisation & Visualisation
Histogram
- Customize:
- Title, X-axis, Y-axis labels
- Bar color
- Theme: Default, Gray, Minimal, Classic, Dark
- Click “Draw Histogram” to render the plot.
- Click “Download Histogram” to export it as a PNG image file.
Plot Customize
- Customize:
- Title, X-axis, Y-axis labels
- Box color
- Theme
- Click “Draw Box Plot” to render the plot (without outlier detection).
- Click “Download Box Plot” to export it as a PNG image file.
5. Export & Download Options
After the calculation, the results can be exported in multiple formats.
- Print: Opens the print dialogue.
- Download TXT: Saves results in plain. txt file.
- Download PDF: Saves a PDF with statistics and embedded plots.
- Download Excel: Saves results in an Excel format. xlsx file.
6. Useful Tips
- Ensure that all data entries are numeric (non-numeric values are ignored).
- For file uploads, select the correct numeric column for analysis.
- Use theme settings to match your presentation or report styles.
- Redraw the charts if you change the themes or plot settings.
If you use Excel, there are calculators for this as well. They make it easy to work with data in Excel.
In summary, a calculating descriptive statistics calculator simplifies data analysis. It is beneficial for anyone, regardless of whether they use an online tool or an Excel calculator. The steps are the same, helping you gain important insights from your data.
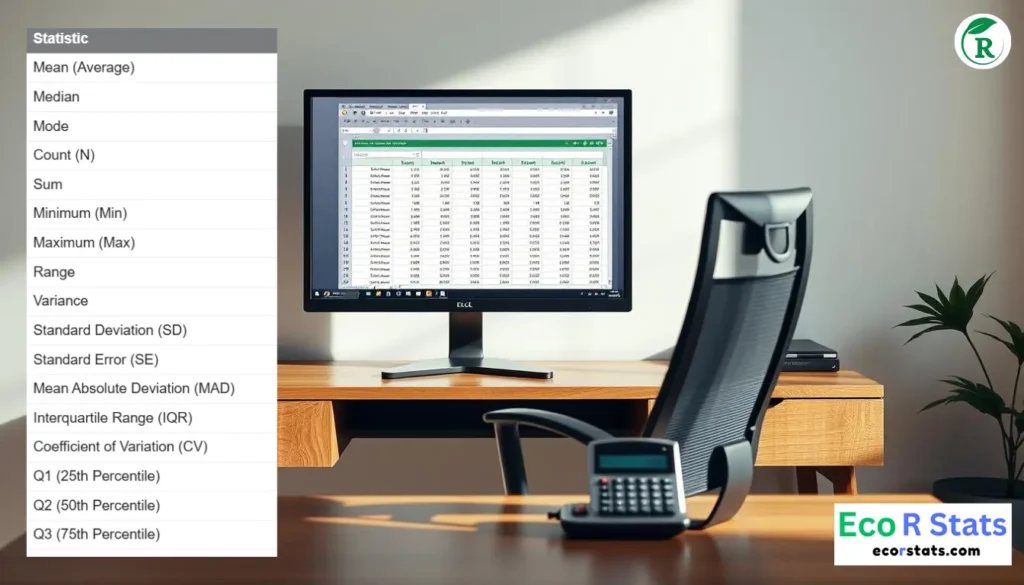
Metrics Available in Descriptive Statistics Calculator Online
| Metrics | Value |
|---|---|
| Mean (Average) | 48.50 |
| Median | 45.50 |
| Standard Deviation | 3.16 |
| Mode | 45 |
| Count (N) | 10 |
| Sum | 485.00 |
| Minimum (Min) | 34 |
| Maximum (Max) | 60 |
| Range | 26 |
| Variance | 95.83 |
| Standard Deviation (SD) | 9.79 |
| Standard Error (SE) | 3.10 |
| Mean Absolute Deviation (MAD) | 8.20 |
| Interquartile Range (IQR) | 12.75 |
| Coefficient of Variation (CV) | 20.18% |
| Q1 (25th Percentile) | 45.00 |
| Q2 (50th Percentile) | 45.50 |
| Q3 (75th Percentile) | 57.75 |
| 10th Percentile | 34.90 |
| 90th Percentile | 60.00 |
| Skewness | -0.17 |
| Kurtosis | -1.34 |
| Z-score for Skewness | -0.22 |
| Z-score for Kurtosis | -0.86 |
| Geometric Mean | 47.57 |
| Harmonic Mean | 46.62 |
| Trimmed Mean (5%) | 48.50 |
| Mode Frequency | 3 |
| Relative Frequency | 0.3000 |
| Cumulative Frequency | 10 |
| Sum of Squares (SS) | 862.50 |
| 95% Confidence Interval | 42.43 – 54.57 |
Using a free online descriptive statistics calculator provides many useful metrics. These tools help me better understand datasets. They offer important measures such as central tendency, dispersion, and frequency distribution.
Measures of Central Tendency
Central tendency metrics include the mean, median, and mode of the data. These are key to finding the central point of the data. The mean median mode calculator is useful for finding these values. This helps me to see the average and typical values in the data.
Measures of Dispersion
Dispersion measures show how spread out the data points are. The range, variance, and standard deviation are important. A good stats calculator has a simple and standard deviation calculator. This helps me understand how data points differ from the mean.
Frequency Distribution
The frequency distribution shows how often each value appears. Statistical tools were used to create tables and charts. This makes the data easier to see and understand. This is key to finding trends and insights.
Benefits of Using an Online Descriptive Statistics Calculator
Using an online descriptive statistics calculator is very easy. You do not need to download any software. You can use the Internet to do your math from anywhere.
This makes obtaining answers fast and easy. You can perform data analysis quickly.
These online tools are also highly flexible. They work with several types of data. You can upload your data in CSV or Excel format.
They also show the data in pictures. This makes it easier to understand complex statistics.
Moreover, these calculators are easy to use. They work well for both novices and experts. You do not need to know much about statistics to use them.
In summary, online statistical calculators are very helpful. They make it easy to understand and work with the data. They are a great tool for anyone who needs to analyze the data.
Descriptive Statistics in Data Visualization
Descriptive statistics are key to making big data easy to understand. They used tools such as the mean, median, and standard deviation. This helps us create charts and graphs that are easy to understand.
An online statistics calculator makes this even easier. It quickly provides important statistics. This helps identify odd data points and observe how the data are distributed.
Calculating Mean, Median, and Mode with a Calculator
Using a calculator to calculate statistical data is helpful. This makes it easy to find the mean, median, and mode. These are key components of descriptive statistics.
To find the mean, enter your data into the calculator. It adds all the numbers and divides by how many there are in the set. This provides a quick overview of the data.
To find the median, sort the data and find the middle number. If there is an even number of numbers, the calculator averages the two middle numbers. This helps you see how your data are spread out.
Finally, the mode shows the value that occurs most frequently. The calculator identifies these common values. This adds more detail to the analysis.
A statistical mean calculator helps you understand your data quickly and accurately. This makes the analysis quick and thorough.
Understanding Standard Deviation and Variance
The standard deviation and variance are key when working with data. They show how the numbers are spread out. A standard deviation calculator determines the average distance from the mean. Variance shows the average squared distance from the mean.
Calculating these by hand can be difficult and may result in mistakes. Therefore, a statistical standard deviation calculator is helpful. This makes the calculations fast and accurate.
Let us consider an example to understand why these measures are important. Imagine that you have two groups of exam scores:
| Metrics | Set A | Set B |
|---|---|---|
| Mean | 75 | 75 |
| Variance | 10 | 50 |
| Standard Deviation | 3.16 | 7.07 |
Although the means are the same, Set B has a wider spread than Set A. An online descriptive statistics calculator clearly shows this. This helps make better choices.
Descriptive Analytics for Business Insights
Descriptive analytics provides deep insights into how people and businesses act. It uses tools such as a business statistics calculator to quickly analyze large amounts of data.
Consumer Behaviour Analysis
Knowing what people like and do is key to good marketing and a better user experience. A data analysis tool breaks down buying habits, how much people engage, and what they like to do. This helps make smarter choices and improves plans.
Performance Metrics
Checking how well a business is doing is important for growth. A statistical metrics calculator helps to look at important numbers, such as sales and efficiency. This helps in planning and improving the performance.
Choosing the Best Descriptive Analytics Calculator
When selecting the best statistics calculator, consider the following key factors. First, it should be easy to operate. A good descriptive analytics calculator allows users to enter data quickly and provides detailed summary.
It is also important that the calculator works with many data types. The best statistical summary calculator can handle CSV, Excel, etc.. Look at the statistics it can show, such as the mean, median, and standard deviation.
The ability to visualize data in pictures is also crucial. A great descriptive analytics calculator transforms numbers into charts and graphs. This makes it easier to understand the data.
Do not forget about customer support. Good tools are helpful when needed. They should also speak multiple languages. Reading what others say can help you choose the right tool for your needs.
The following table compares some popular tools:
| Feature | Calculator A | Calculator B | Calculator C |
|---|---|---|---|
| User-Friendliness | High | Medium | High |
| Data Format Compatibility | CSV, Excel | CSV, JSON | CSV, Excel, JSON |
| Statistical Metrics Offered | 10+ | 8 | 15+ |
| Data Visualization | Yes | No | Yes |
| Customer Support | 24/7 | Business Hours | 24/7 |
| Multilingual Options | Yes | No | Yes |
Examples of Descriptive Statistics in Research
Descriptive statistics are key to research. They provide a first look at the datasets. A statistical summary generator helps researchers quickly identify important patterns and trends. Let us examine some examples where they are helpful.
For instance, when checking student scores, we use the mean, standard deviation, and patterns. This helps us see how students are doing overall and identify any students who stand out. In surveys about customer happiness, descriptive statistics provide a quick overview of what people think. They show the average happiness and how varied the answers are.
In market research, descriptive statistics are very important. With tools such as a statistical mean median mode calculator, experts can quickly identify key points. This is important before using more complex methods. This ensures that our research is robust.
Let us look at a comparison of student scores using descriptive statistics.
| Grade Level | Mean Score | Median Score | Mode Score | Standard Deviation |
|---|---|---|---|---|
| Elementary | 78 | 80 | 85 | 6.5 |
| Middle School | 82 | 83 | 88 | 7.2 |
| High School | 85 | 86 | 90 | 5.8 |
These examples of descriptive statistics show their importance. Using tools such as a statistical summary generator makes it easier. It helps those who are new to data analysis.
Conclusion
Descriptive statistics calculators have changed the way we analyze data. They make it easy and accurate to understand the numbers and pictures. Tools such as the online statistics calculator can be used to perform a detailed analysis quickly.
Using an online statistics calculator is very helpful. This makes it easier and faster to understand the data. It is great for anyone who wants to use data to make smart choices.
A good statistical tool can change how you work with data. This helps you find important insights and make better choices. As data grows, having a reliable calculator keeps you ahead of the competition. This allows you to use your data to its fullest.
FAQ
What is a descriptive statistics calculator?
Descriptive statistics calculator is an online tool. It helps find important statistics such as the mean, median, and standard deviation. You only need to enter your data. It also shows charts to help you better understand your data.
How do I calculate descriptive statistics online?
First, enter the data into the calculator. Then, select the statistics you want to see. You will receive numbers and charts immediately.
What are the common measures provided by a descriptive statistics calculator?
It shows the mean, median, and mode. The range, variance, and standard deviation are also observed. These help to understand how spread out the data are.
How can these calculators assist with data visualization?
They convert complex data into easy-to-read charts and graphs. This makes it easy to spot trends and odd points in your data.
What is the importance of the measures of central tendency?
Measures such as the mean, median, and mode show the middle of your data. They provide key insights into the overall performance of the data.
What are the measures of dispersion?
These include the range, variance, and standard deviation. They show how far apart the data points are. This helps in understanding the spread of the data.
What is the frequency distribution?
It shows how often data values occur in certain ranges. It is often presented in tables or as charts. This helps to identify patterns in the data.
Why should I use an online descriptive statistics calculator?
They are easy to use, provide quick results, and do not require software downloads. They work with many data types and show charts for a better understanding.
How do descriptive analytics calculators benefit businesses
They assist businesses by analyzing customer data and performance. This provides insights into better strategies and happier customers.
How do I input and analyze data online using these calculators?
Simply select your data, choose the desired analysis, and enter it into the calculator. It will show detailed statistics and charts.
What should I consider when choosing a descriptive analytics calculator?
Consider how easy it is to use, what data formats it supports, and the statistics it offers. In addition, check out its charts and customer support.
How are descriptive statistics used in the research?
They help understand data in research, such as student scores or market studies. They use statistics, such as the mean and variability, to analyze the data.
How do these tools calculate the mean, median, and mode?
You can enter your data into the calculator. It uses special algorithms to quickly and accurately find these important statistics.
What is the significance of the standard deviation and variance?
The standard deviation shows how far the data points are from the mean. The variance is the average of these squared differences. Both are key to understanding the data spread. far data points are from the mean. Variance is the average of these squared differences. Both are key for understanding data spread.